| __timestamp | Trane Technologies plc | Watsco, Inc. |
|---|---|---|
| Wednesday, January 1, 2014 | 3908600000 | 956402000 |
| Thursday, January 1, 2015 | 3999100000 | 1007357000 |
| Friday, January 1, 2016 | 4179600000 | 1034584000 |
| Sunday, January 1, 2017 | 4386000000 | 1065659000 |
| Monday, January 1, 2018 | 4820600000 | 1120252000 |
| Tuesday, January 1, 2019 | 5147400000 | 1156956000 |
| Wednesday, January 1, 2020 | 3803400000 | 1222821000 |
| Friday, January 1, 2021 | 4469600000 | 1667545000 |
| Saturday, January 1, 2022 | 4964800000 | 2030289000 |
| Sunday, January 1, 2023 | 5857200000 | 1992140000 |
| Monday, January 1, 2024 | 7080500000 | 2044713000 |
Unlocking the unknown
In the competitive landscape of industrial manufacturing, Trane Technologies plc and Watsco, Inc. have showcased remarkable financial trajectories over the past decade. From 2014 to 2023, Trane Technologies consistently outperformed Watsco in gross profit, with a notable 50% increase from 2014 to 2023. In 2023, Trane Technologies achieved a gross profit of approximately $5.86 billion, marking a significant recovery from a dip in 2020.
Conversely, Watsco, Inc. demonstrated steady growth, with a 108% increase in gross profit from 2014 to 2022, peaking at around $2.03 billion. Despite a slight decline in 2023, Watsco's performance underscores its resilience in the HVAC distribution sector.
This analysis highlights the dynamic shifts in the industrial sector, where strategic innovation and market adaptation play crucial roles in financial success.
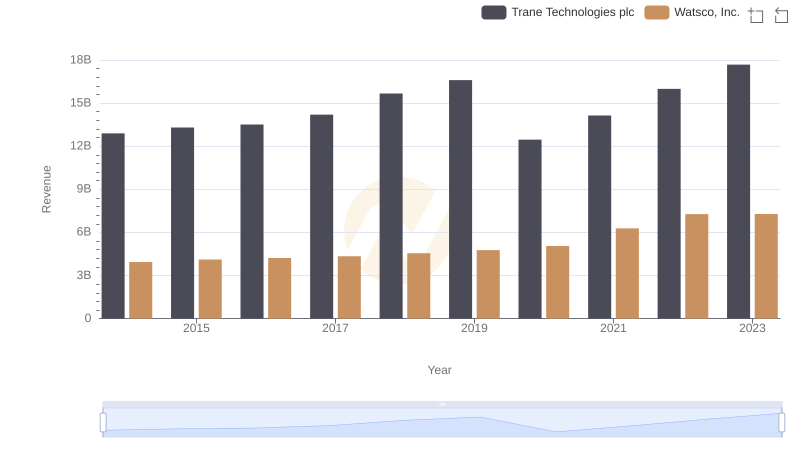
Trane Technologies plc or Watsco, Inc.: Who Leads in Yearly Revenue?
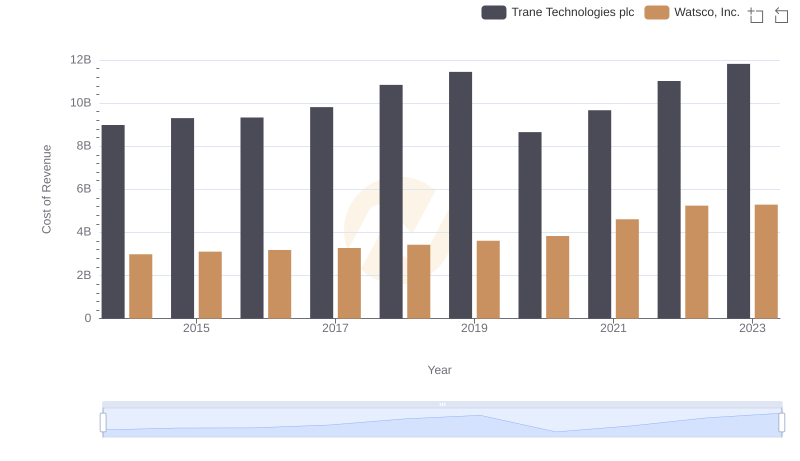
Cost of Revenue Trends: Trane Technologies plc vs Watsco, Inc.
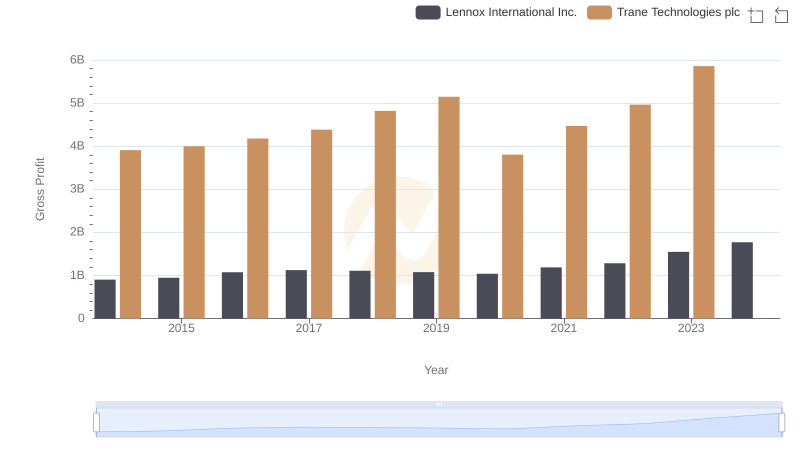
Trane Technologies plc and Lennox International Inc.: A Detailed Gross Profit Analysis
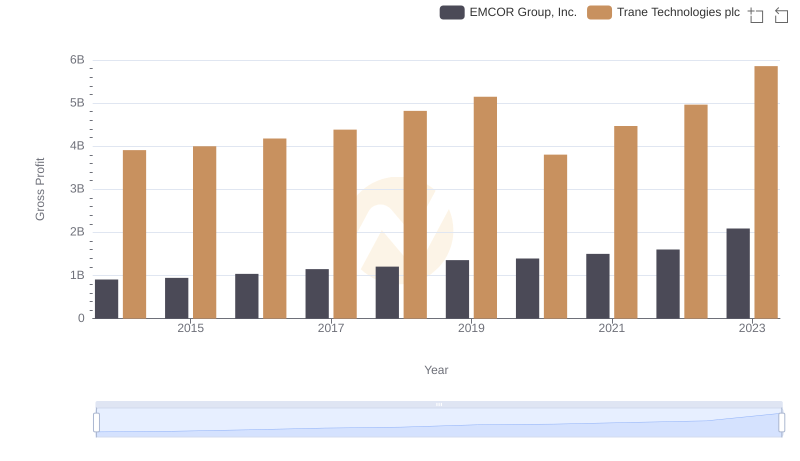
Gross Profit Trends Compared: Trane Technologies plc vs EMCOR Group, Inc.
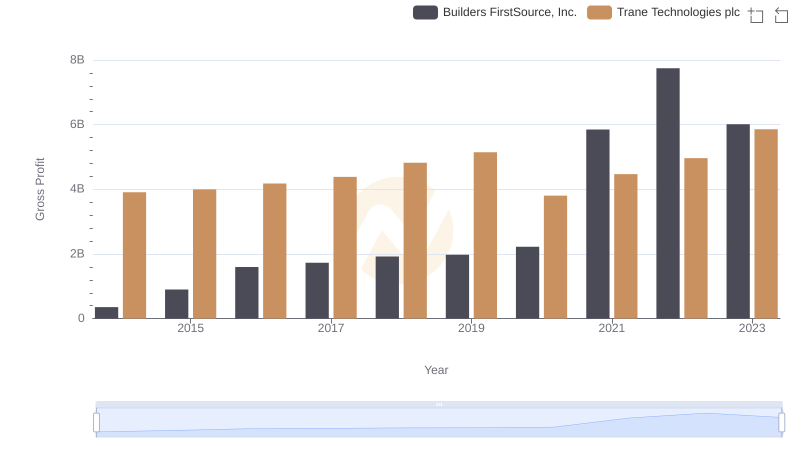
Who Generates Higher Gross Profit? Trane Technologies plc or Builders FirstSource, Inc.

Gross Profit Trends Compared: Trane Technologies plc vs Hubbell Incorporated
Gross Profit Trends Compared: Trane Technologies plc vs AerCap Holdings N.V.
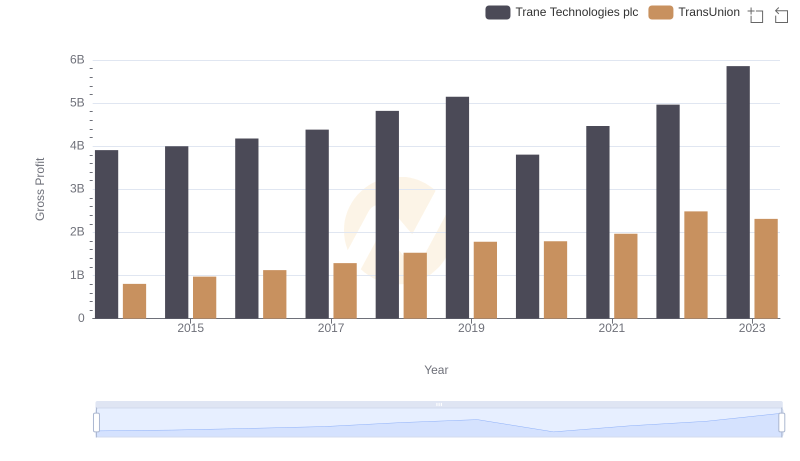
Who Generates Higher Gross Profit? Trane Technologies plc or TransUnion

Cost Management Insights: SG&A Expenses for Trane Technologies plc and Watsco, Inc.
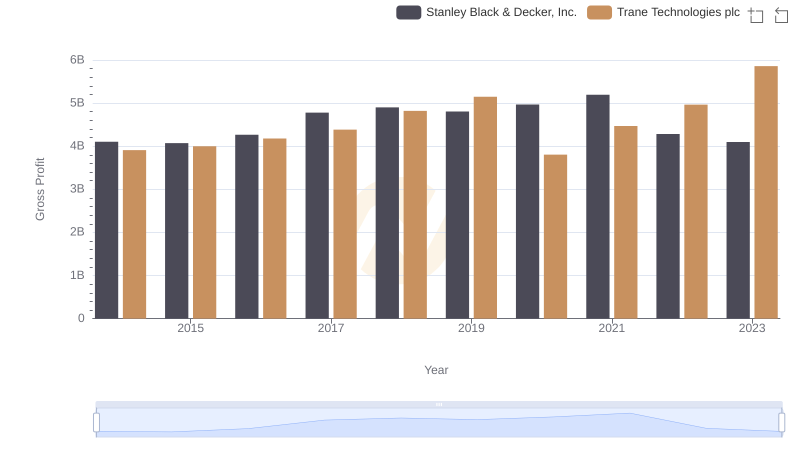
Gross Profit Comparison: Trane Technologies plc and Stanley Black & Decker, Inc. Trends
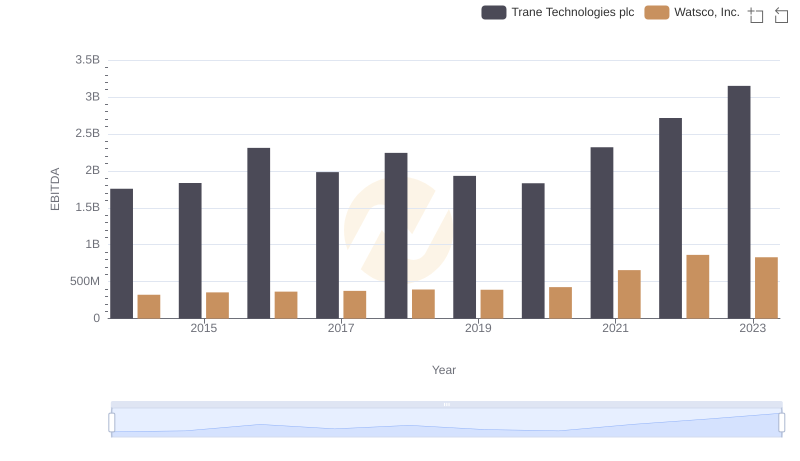
EBITDA Metrics Evaluated: Trane Technologies plc vs Watsco, Inc.