| __timestamp | Hubbell Incorporated | Trane Technologies plc |
|---|---|---|
| Wednesday, January 1, 2014 | 591600000 | 2503900000 |
| Thursday, January 1, 2015 | 617200000 | 2541100000 |
| Friday, January 1, 2016 | 622900000 | 2606500000 |
| Sunday, January 1, 2017 | 648200000 | 2720700000 |
| Monday, January 1, 2018 | 743500000 | 2903200000 |
| Tuesday, January 1, 2019 | 756100000 | 3129800000 |
| Wednesday, January 1, 2020 | 676300000 | 2270600000 |
| Friday, January 1, 2021 | 619200000 | 2446300000 |
| Saturday, January 1, 2022 | 762500000 | 2545900000 |
| Sunday, January 1, 2023 | 848600000 | 2963200000 |
| Monday, January 1, 2024 | 812500000 | 3580400000 |
Data in motion
In the competitive landscape of industrial manufacturing, understanding the efficiency of Selling, General, and Administrative (SG&A) expenses is crucial. Trane Technologies plc and Hubbell Incorporated, two stalwarts in the industry, have shown distinct trends over the past decade. From 2014 to 2023, Trane Technologies consistently outpaced Hubbell in SG&A spending, peaking in 2019 with a 25% increase from 2014. Meanwhile, Hubbell's expenses grew more modestly, with a 43% rise over the same period. Notably, 2020 marked a dip for Trane, reflecting broader economic challenges. By 2023, both companies rebounded, with Trane's expenses nearing 3 billion and Hubbell's reaching 850 million. This analysis highlights the strategic allocation of resources, with Trane investing heavily in growth and innovation, while Hubbell maintains a steady, conservative approach. As the industry evolves, these trends offer insights into each company's operational priorities and market positioning.

Breaking Down Revenue Trends: Trane Technologies plc vs Hubbell Incorporated
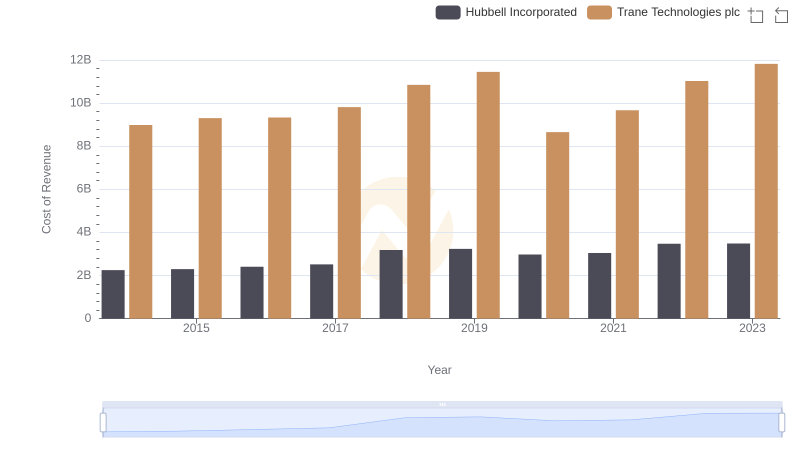
Analyzing Cost of Revenue: Trane Technologies plc and Hubbell Incorporated

Trane Technologies plc and Xylem Inc.: SG&A Spending Patterns Compared

Gross Profit Trends Compared: Trane Technologies plc vs Hubbell Incorporated
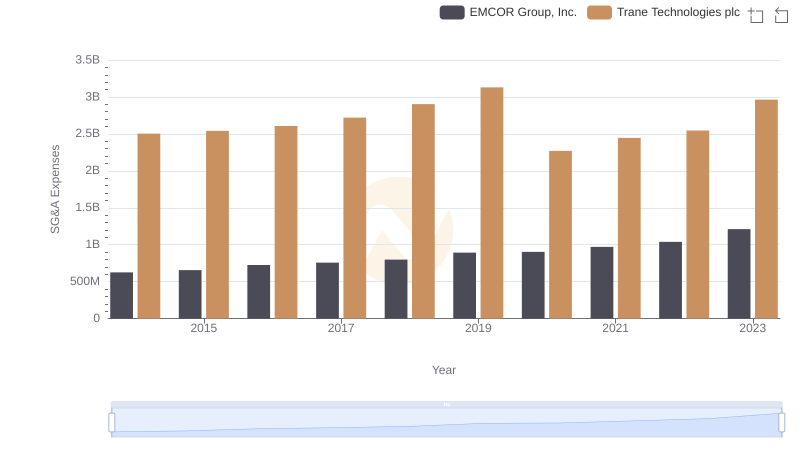
Trane Technologies plc vs EMCOR Group, Inc.: SG&A Expense Trends
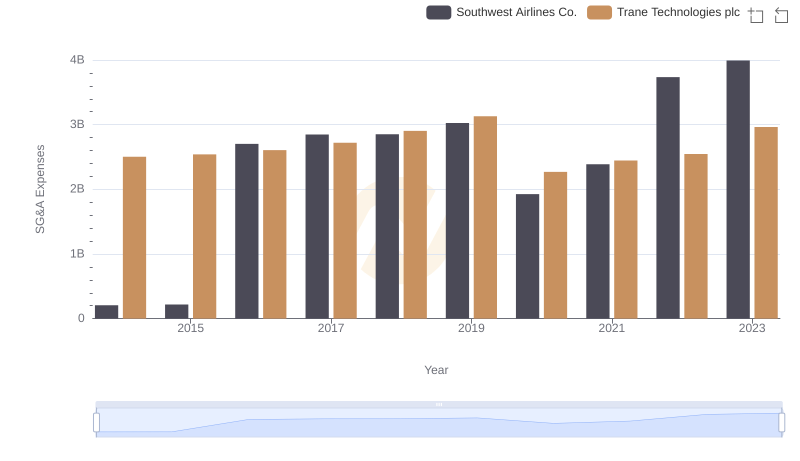
Operational Costs Compared: SG&A Analysis of Trane Technologies plc and Southwest Airlines Co.

Cost Management Insights: SG&A Expenses for Trane Technologies plc and Builders FirstSource, Inc.
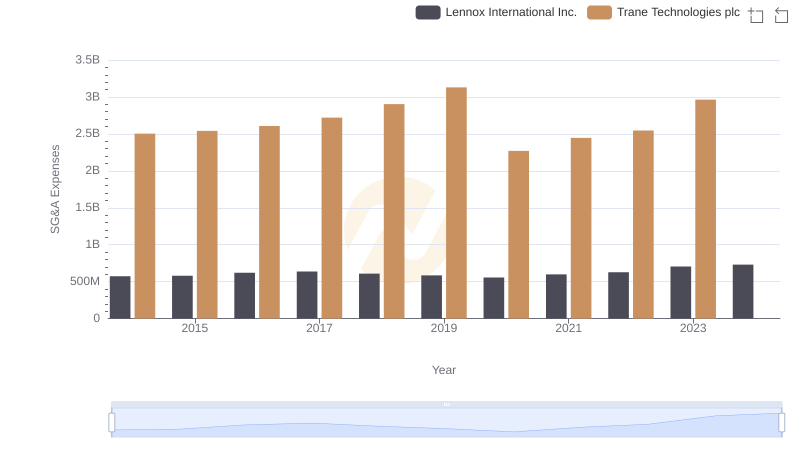
Selling, General, and Administrative Costs: Trane Technologies plc vs Lennox International Inc.

Cost Management Insights: SG&A Expenses for Trane Technologies plc and Watsco, Inc.
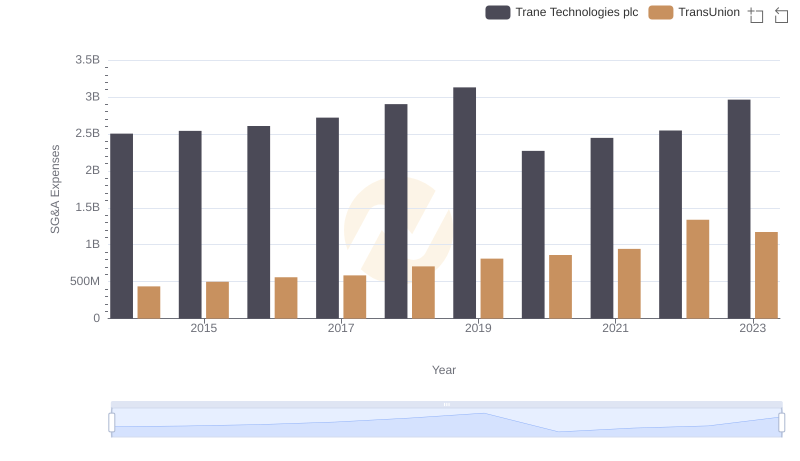
Breaking Down SG&A Expenses: Trane Technologies plc vs TransUnion
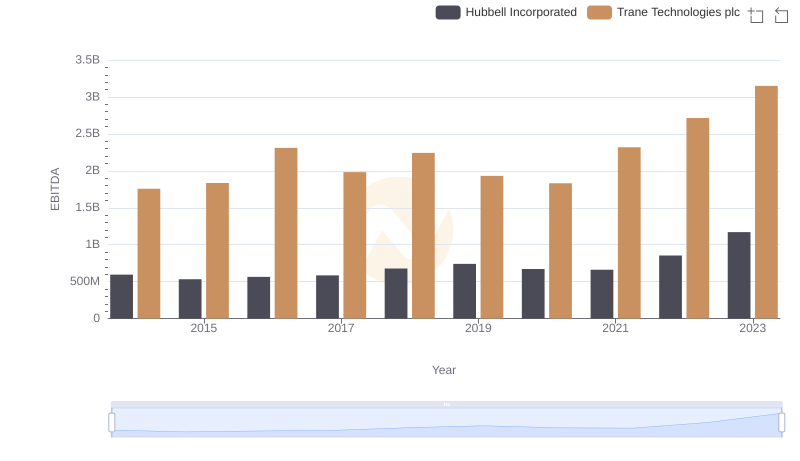
Trane Technologies plc and Hubbell Incorporated: A Detailed Examination of EBITDA Performance