| __timestamp | Trane Technologies plc | Xylem Inc. |
|---|---|---|
| Wednesday, January 1, 2014 | 3908600000 | 1513000000 |
| Thursday, January 1, 2015 | 3999100000 | 1404000000 |
| Friday, January 1, 2016 | 4179600000 | 1461000000 |
| Sunday, January 1, 2017 | 4386000000 | 1851000000 |
| Monday, January 1, 2018 | 4820600000 | 2026000000 |
| Tuesday, January 1, 2019 | 5147400000 | 2046000000 |
| Wednesday, January 1, 2020 | 3803400000 | 1830000000 |
| Friday, January 1, 2021 | 4469600000 | 1975000000 |
| Saturday, January 1, 2022 | 4964800000 | 2084000000 |
| Sunday, January 1, 2023 | 5857200000 | 2717000000 |
| Monday, January 1, 2024 | 7080500000 |
Unleashing the power of data
In the ever-evolving landscape of industrial innovation, Trane Technologies plc and Xylem Inc. have emerged as key players. Over the past decade, from 2014 to 2023, these companies have demonstrated remarkable growth in gross profit, reflecting their strategic prowess and market adaptability.
Trane Technologies has seen a robust increase of approximately 50% in gross profit, peaking in 2023 with a staggering 5.86 billion. This growth underscores their commitment to sustainable solutions and energy-efficient technologies. Meanwhile, Xylem Inc. has also shown a commendable rise, with a 79% increase, reaching 2.72 billion in 2023. Their focus on water technology and smart infrastructure has clearly paid off.
This comparative analysis not only highlights the financial health of these companies but also offers insights into their strategic directions, making it a must-read for investors and industry enthusiasts alike.
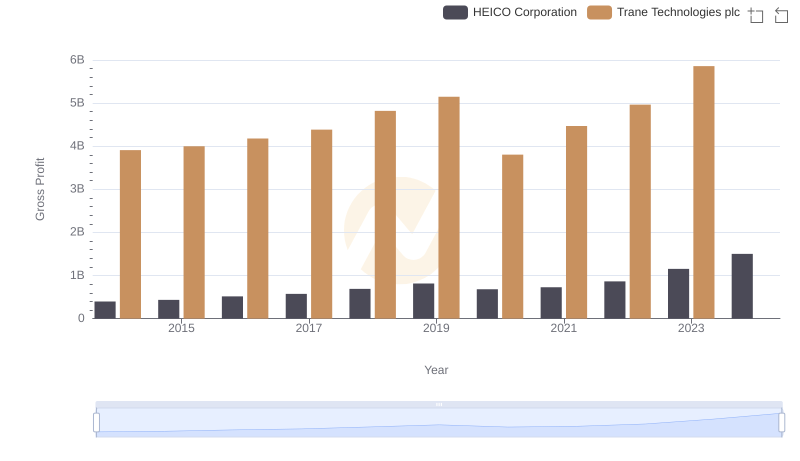
Who Generates Higher Gross Profit? Trane Technologies plc or HEICO Corporation
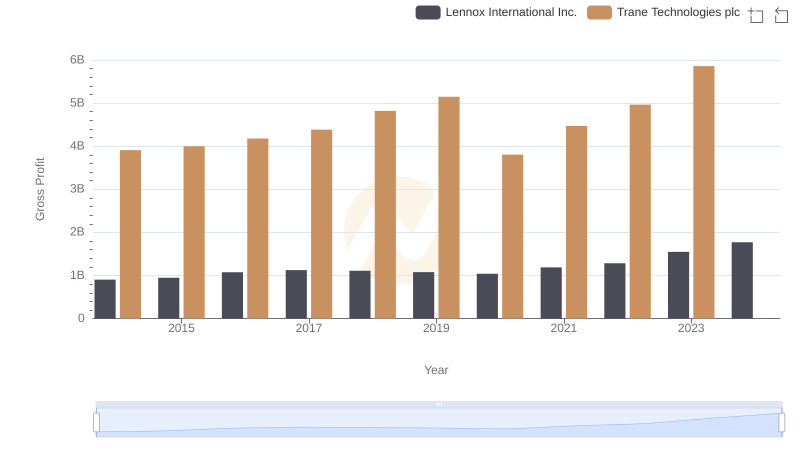
Trane Technologies plc and Lennox International Inc.: A Detailed Gross Profit Analysis
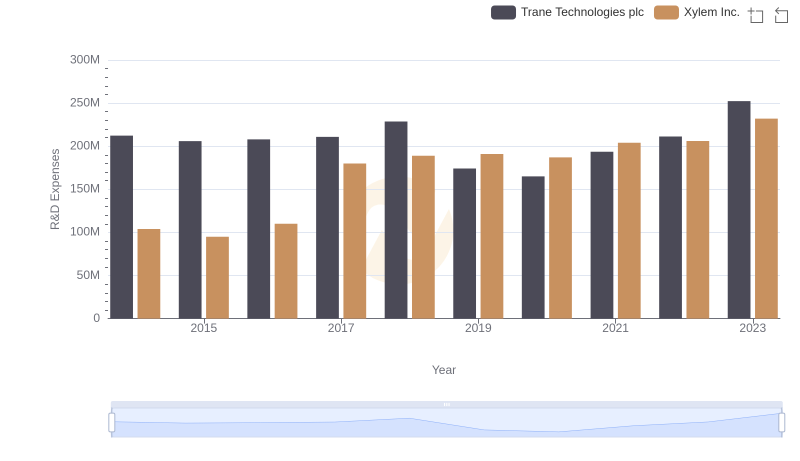
Research and Development Expenses Breakdown: Trane Technologies plc vs Xylem Inc.
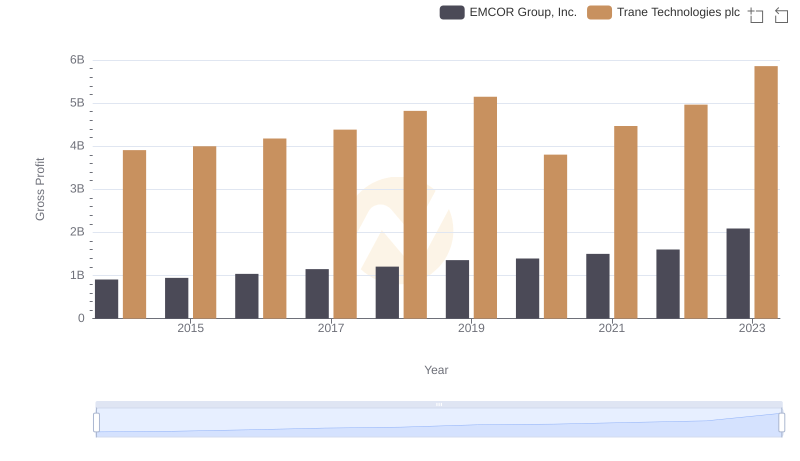
Gross Profit Trends Compared: Trane Technologies plc vs EMCOR Group, Inc.
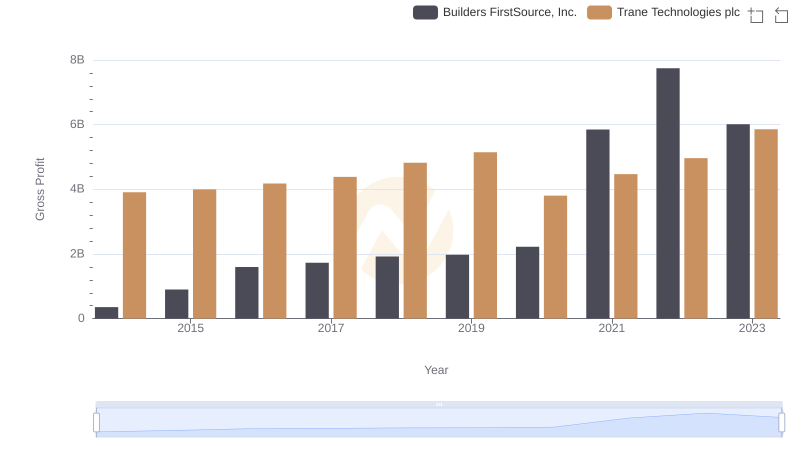
Who Generates Higher Gross Profit? Trane Technologies plc or Builders FirstSource, Inc.

Trane Technologies plc and Xylem Inc.: SG&A Spending Patterns Compared

Gross Profit Trends Compared: Trane Technologies plc vs Hubbell Incorporated
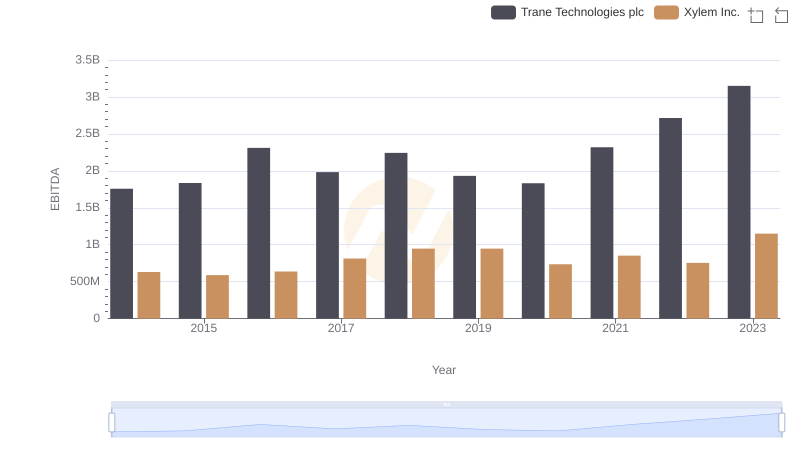
A Professional Review of EBITDA: Trane Technologies plc Compared to Xylem Inc.