| __timestamp | AerCap Holdings N.V. | Trane Technologies plc |
|---|---|---|
| Wednesday, January 1, 2014 | 1282919000 | 3908600000 |
| Thursday, January 1, 2015 | 1822255000 | 3999100000 |
| Friday, January 1, 2016 | 1686404000 | 4179600000 |
| Sunday, January 1, 2017 | 1660054000 | 4386000000 |
| Monday, January 1, 2018 | 1500345000 | 4820600000 |
| Tuesday, January 1, 2019 | 1678249000 | 5147400000 |
| Wednesday, January 1, 2020 | 1276496000 | 3803400000 |
| Friday, January 1, 2021 | 1301517000 | 4469600000 |
| Saturday, January 1, 2022 | 2109708000 | 4964800000 |
| Sunday, January 1, 2023 | 4337648000 | 5857200000 |
| Monday, January 1, 2024 | 7080500000 |
Igniting the spark of knowledge
In the ever-evolving landscape of global business, Trane Technologies plc and AerCap Holdings N.V. stand as titans in their respective industries. Over the past decade, these companies have showcased remarkable resilience and growth. From 2014 to 2023, Trane Technologies has consistently outperformed AerCap in terms of gross profit, with an average of 4.55 billion compared to AerCap's 1.87 billion. Notably, Trane Technologies saw a 50% increase in gross profit from 2014 to 2023, peaking at 5.86 billion in 2023. Meanwhile, AerCap experienced a significant surge in 2023, with gross profit more than tripling from the previous year, reaching 4.34 billion. This dramatic rise highlights AerCap's strategic maneuvers in the aviation leasing sector. As we delve into these trends, it becomes evident that both companies are navigating their paths with distinct strategies, reflecting broader economic shifts and industry dynamics.
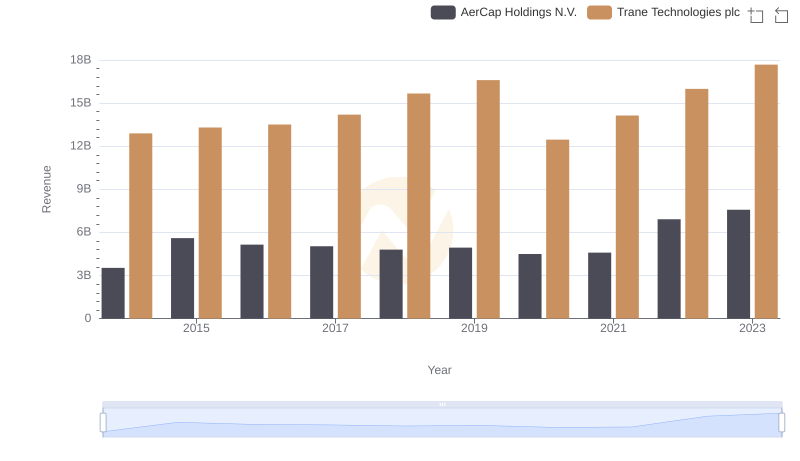
Revenue Insights: Trane Technologies plc and AerCap Holdings N.V. Performance Compared
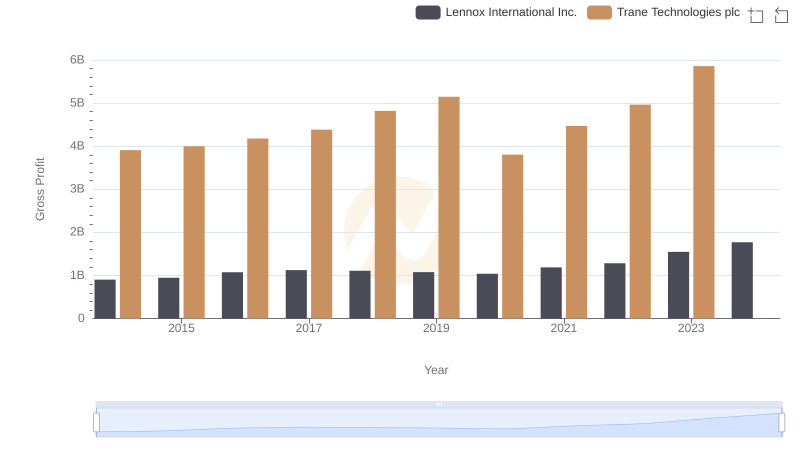
Trane Technologies plc and Lennox International Inc.: A Detailed Gross Profit Analysis
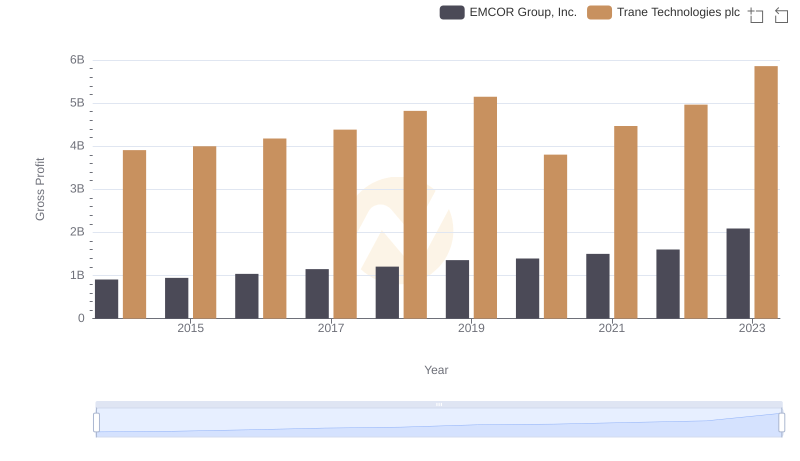
Gross Profit Trends Compared: Trane Technologies plc vs EMCOR Group, Inc.
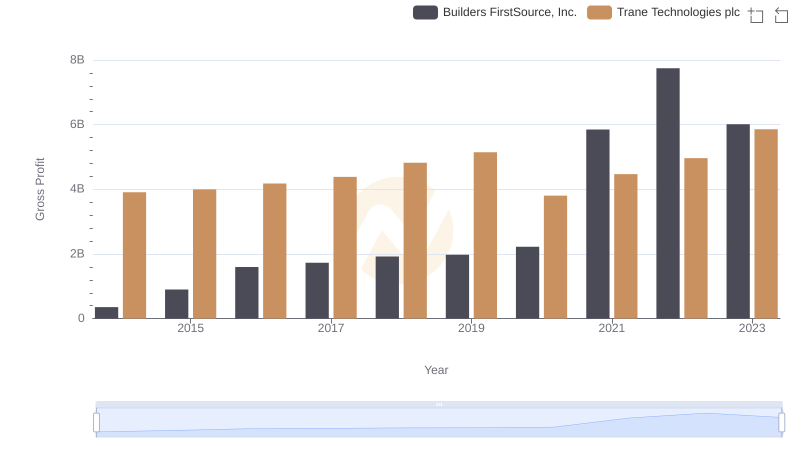
Who Generates Higher Gross Profit? Trane Technologies plc or Builders FirstSource, Inc.
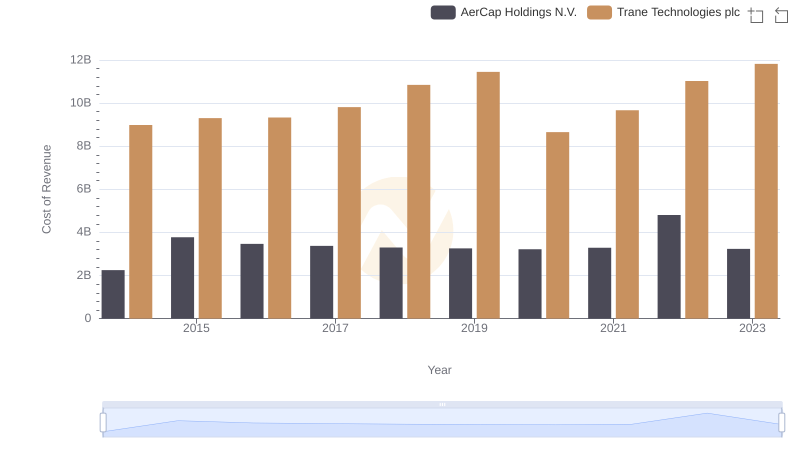
Trane Technologies plc vs AerCap Holdings N.V.: Efficiency in Cost of Revenue Explored

Gross Profit Trends Compared: Trane Technologies plc vs Hubbell Incorporated
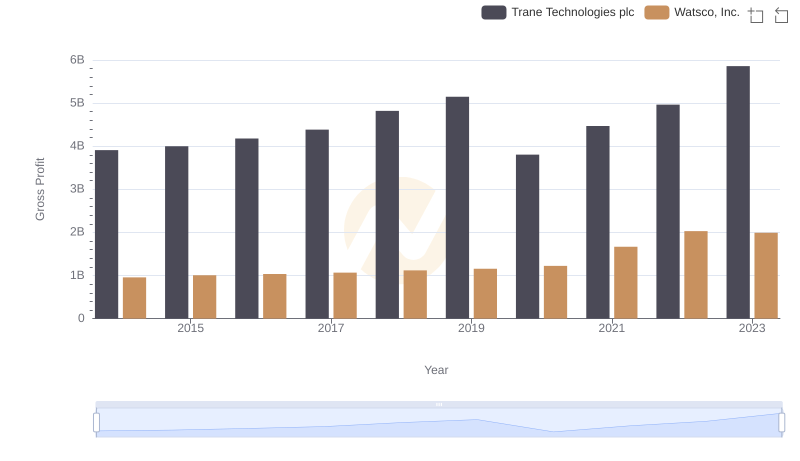
Trane Technologies plc vs Watsco, Inc.: A Gross Profit Performance Breakdown
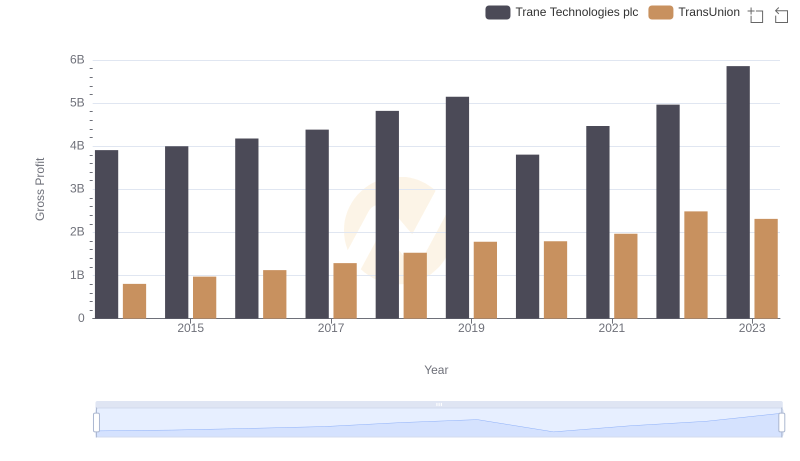
Who Generates Higher Gross Profit? Trane Technologies plc or TransUnion
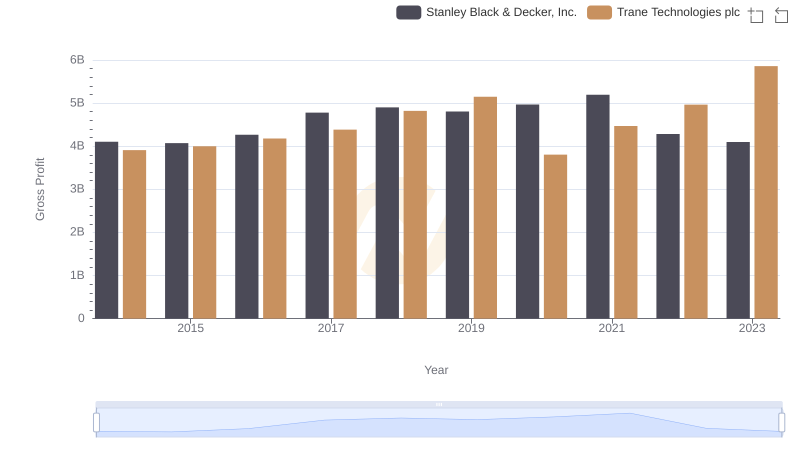
Gross Profit Comparison: Trane Technologies plc and Stanley Black & Decker, Inc. Trends
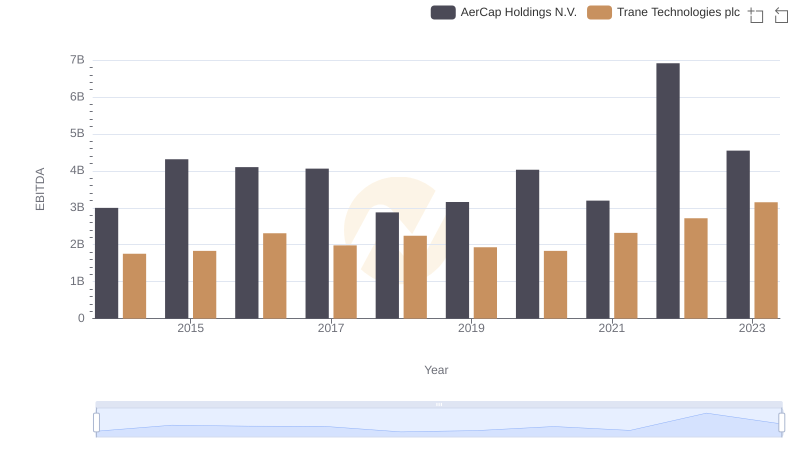
Comprehensive EBITDA Comparison: Trane Technologies plc vs AerCap Holdings N.V.