| __timestamp | Northrop Grumman Corporation | Trane Technologies plc |
|---|---|---|
| Wednesday, January 1, 2014 | 5601000000 | 3908600000 |
| Thursday, January 1, 2015 | 5642000000 | 3999100000 |
| Friday, January 1, 2016 | 5777000000 | 4179600000 |
| Sunday, January 1, 2017 | 5954000000 | 4386000000 |
| Monday, January 1, 2018 | 6791000000 | 4820600000 |
| Tuesday, January 1, 2019 | 7259000000 | 5147400000 |
| Wednesday, January 1, 2020 | 7478000000 | 3803400000 |
| Friday, January 1, 2021 | 7268000000 | 4469600000 |
| Saturday, January 1, 2022 | 7474000000 | 4964800000 |
| Sunday, January 1, 2023 | 6551000000 | 5857200000 |
| Monday, January 1, 2024 | 8362000000 | 7080500000 |
Igniting the spark of knowledge
In the ever-evolving landscape of global industries, understanding financial performance is crucial. This analysis delves into the gross profit trends of Trane Technologies plc and Northrop Grumman Corporation from 2014 to 2023. Over this decade, Northrop Grumman consistently outperformed Trane Technologies, with an average gross profit approximately 45% higher. Notably, Northrop Grumman's gross profit peaked in 2020, reaching nearly 7.5 billion, while Trane Technologies saw its highest gross profit in 2023, at around 5.9 billion. Despite fluctuations, both companies demonstrated resilience, with Northrop Grumman maintaining a steady upward trend until 2022, and Trane Technologies recovering from a dip in 2020. This financial journey highlights the dynamic nature of these corporations, reflecting broader economic conditions and strategic business decisions.
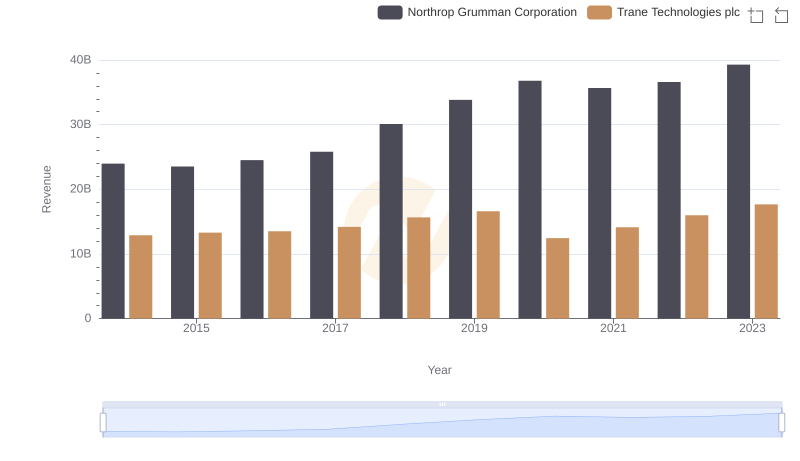
Breaking Down Revenue Trends: Trane Technologies plc vs Northrop Grumman Corporation
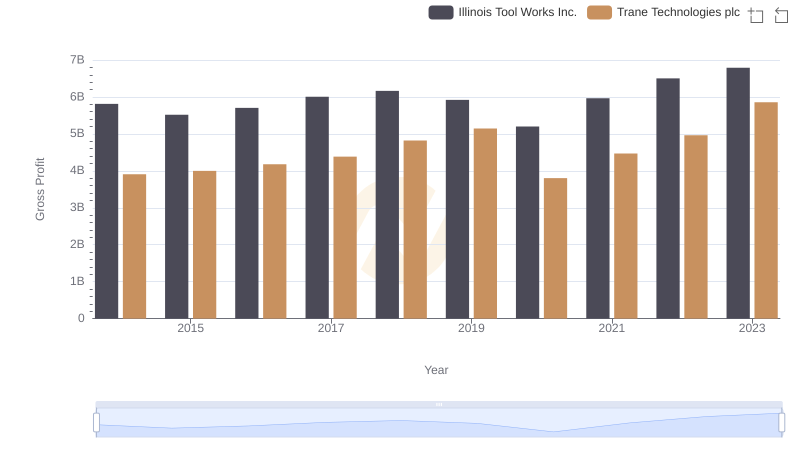
Trane Technologies plc and Illinois Tool Works Inc.: A Detailed Gross Profit Analysis
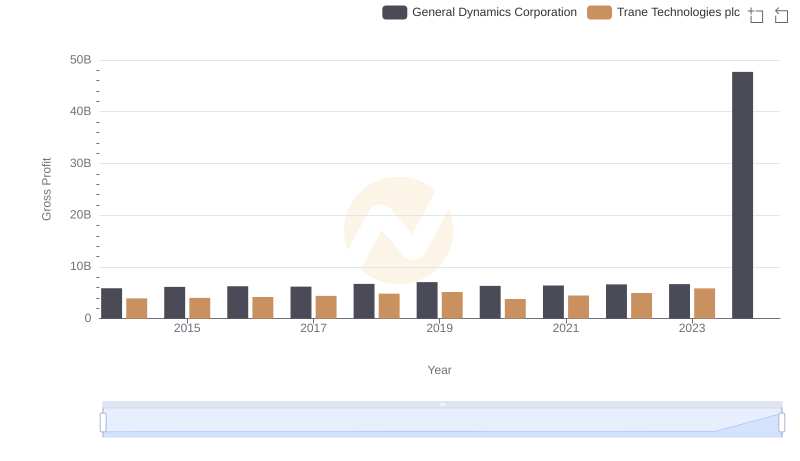
Trane Technologies plc vs General Dynamics Corporation: A Gross Profit Performance Breakdown
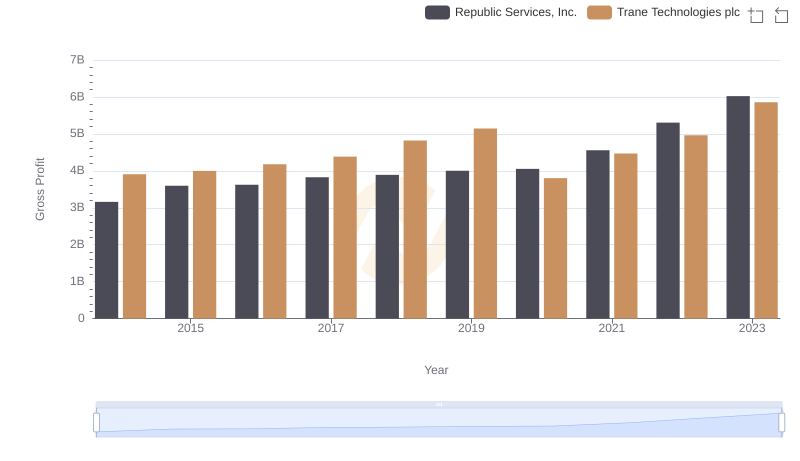
Key Insights on Gross Profit: Trane Technologies plc vs Republic Services, Inc.
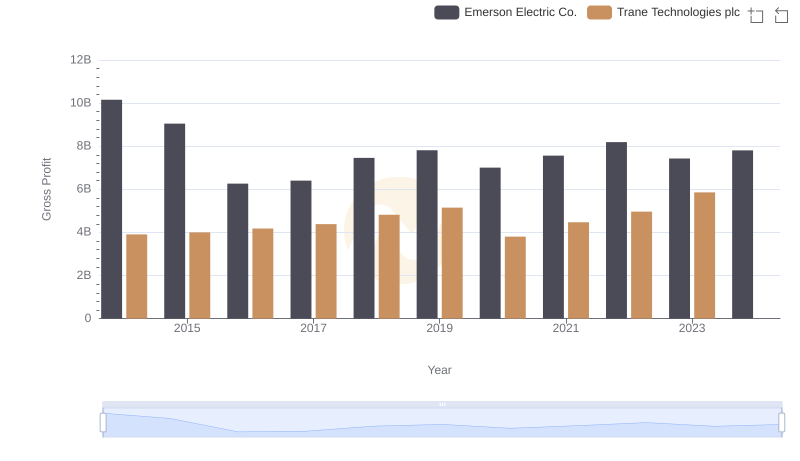
Gross Profit Trends Compared: Trane Technologies plc vs Emerson Electric Co.
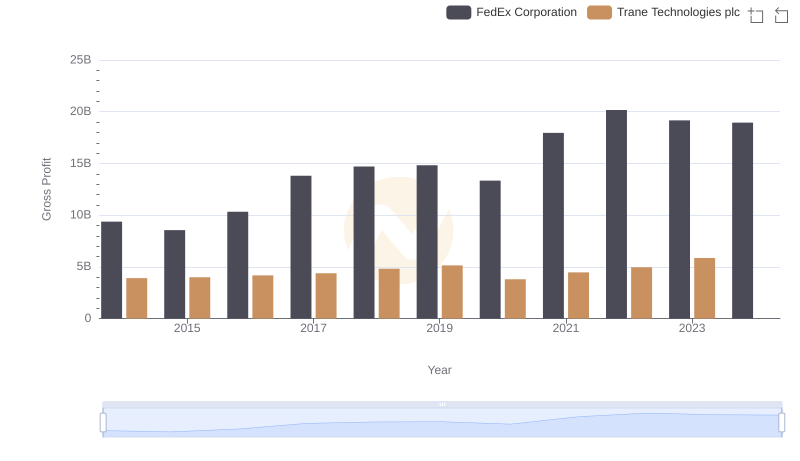
Gross Profit Trends Compared: Trane Technologies plc vs FedEx Corporation

Key Insights on Gross Profit: Trane Technologies plc vs Thomson Reuters Corporation
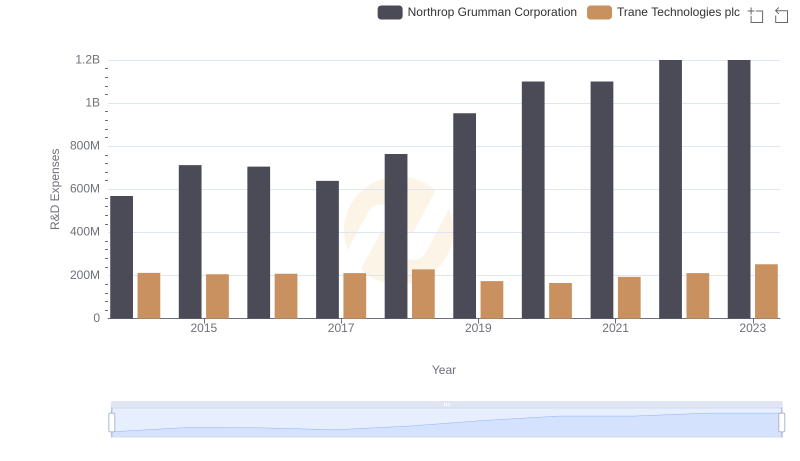
Who Prioritizes Innovation? R&D Spending Compared for Trane Technologies plc and Northrop Grumman Corporation
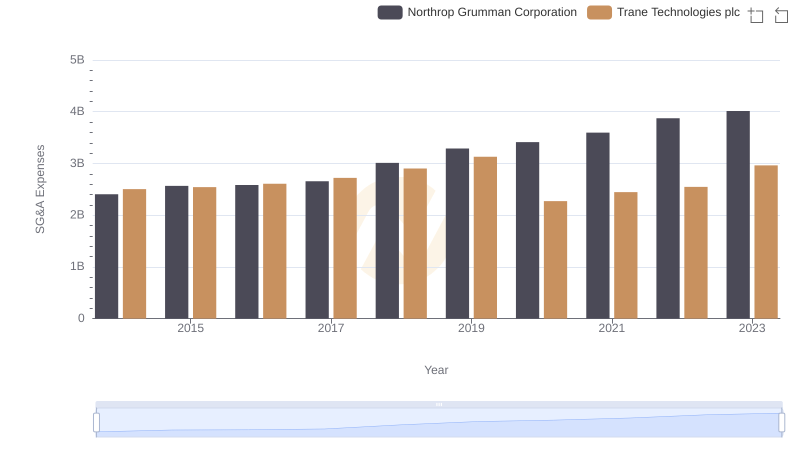
Trane Technologies plc vs Northrop Grumman Corporation: SG&A Expense Trends
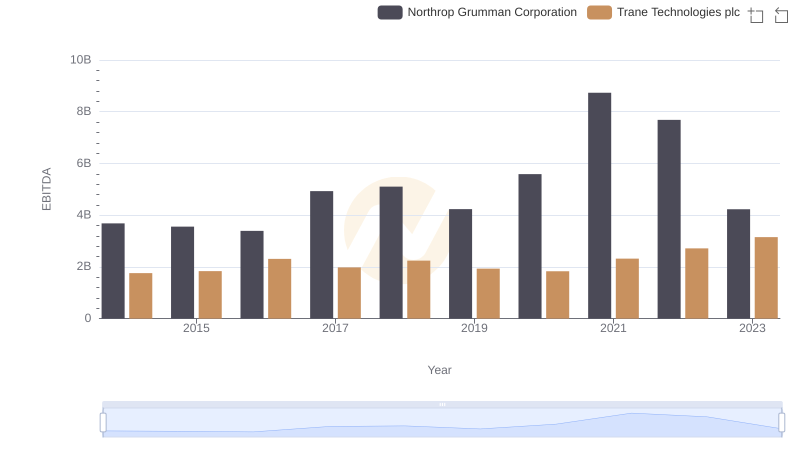
Trane Technologies plc and Northrop Grumman Corporation: A Detailed Examination of EBITDA Performance