| __timestamp | Republic Services, Inc. | Trane Technologies plc |
|---|---|---|
| Wednesday, January 1, 2014 | 3160200000 | 3908600000 |
| Thursday, January 1, 2015 | 3596400000 | 3999100000 |
| Friday, January 1, 2016 | 3623700000 | 4179600000 |
| Sunday, January 1, 2017 | 3826900000 | 4386000000 |
| Monday, January 1, 2018 | 3890900000 | 4820600000 |
| Tuesday, January 1, 2019 | 4001000000 | 5147400000 |
| Wednesday, January 1, 2020 | 4053100000 | 3803400000 |
| Friday, January 1, 2021 | 4557300000 | 4469600000 |
| Saturday, January 1, 2022 | 5306600000 | 4964800000 |
| Sunday, January 1, 2023 | 6022300000 | 5857200000 |
| Monday, January 1, 2024 | 6682000000 | 7080500000 |
Data in motion
In the competitive landscape of industrial and environmental services, Trane Technologies plc and Republic Services, Inc. have demonstrated remarkable growth in gross profit over the past decade. From 2014 to 2023, Trane Technologies saw a robust increase of approximately 50%, peaking at $5.86 billion in 2023. Meanwhile, Republic Services experienced an impressive 90% surge, reaching $6.02 billion in the same year.
This data underscores the dynamic nature of these industries and the strategic maneuvers companies must employ to thrive. As we look to the future, these trends offer valuable insights into the evolving market dynamics.
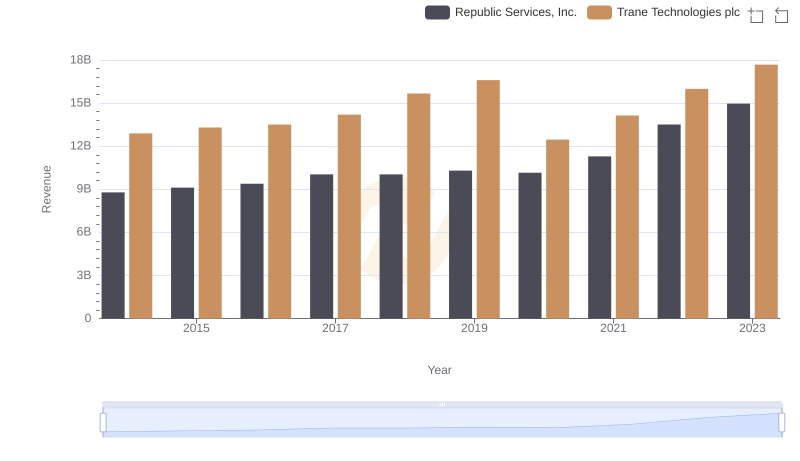
Revenue Insights: Trane Technologies plc and Republic Services, Inc. Performance Compared
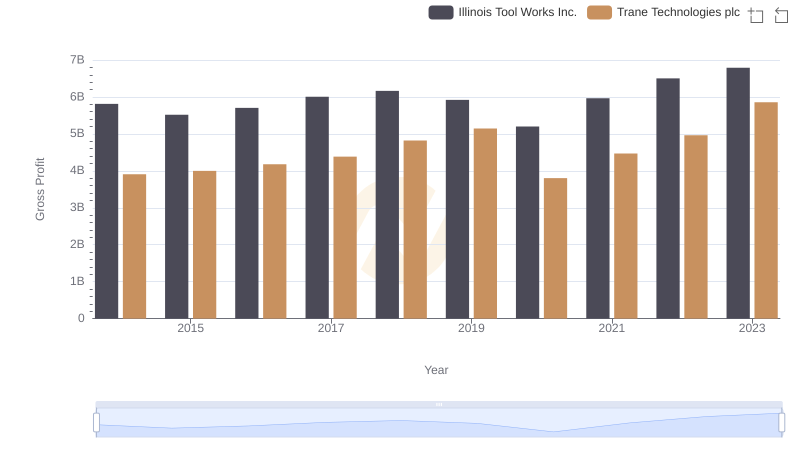
Trane Technologies plc and Illinois Tool Works Inc.: A Detailed Gross Profit Analysis
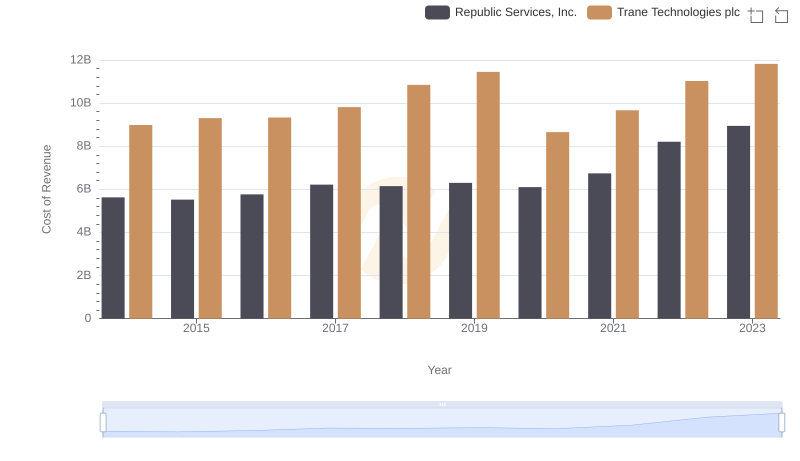
Analyzing Cost of Revenue: Trane Technologies plc and Republic Services, Inc.
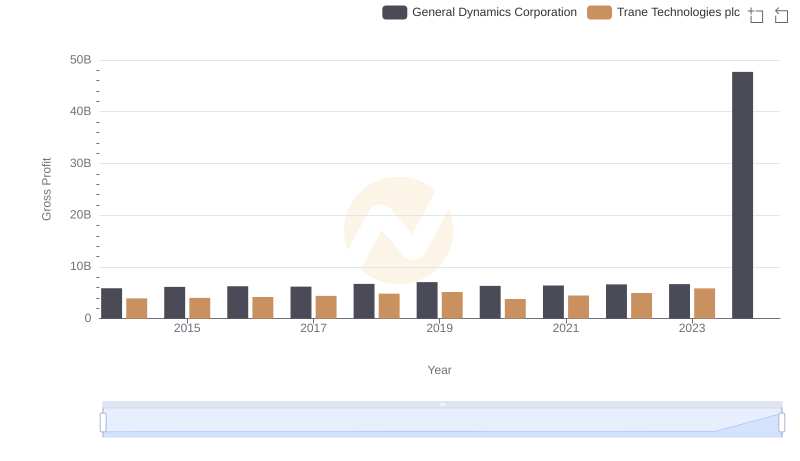
Trane Technologies plc vs General Dynamics Corporation: A Gross Profit Performance Breakdown
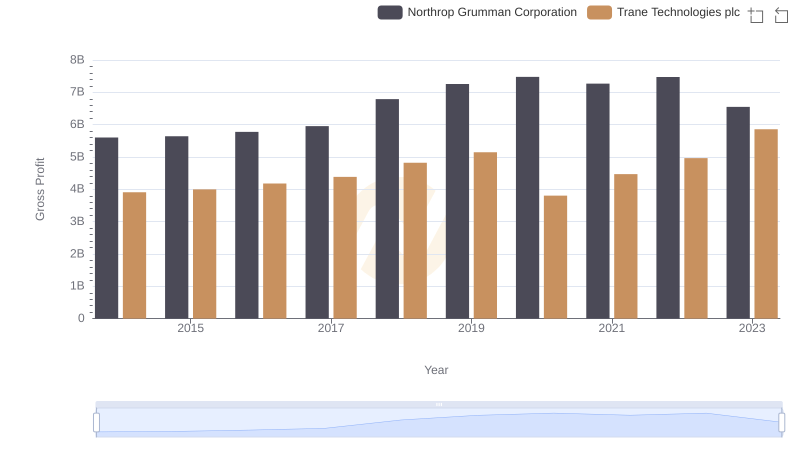
Trane Technologies plc and Northrop Grumman Corporation: A Detailed Gross Profit Analysis
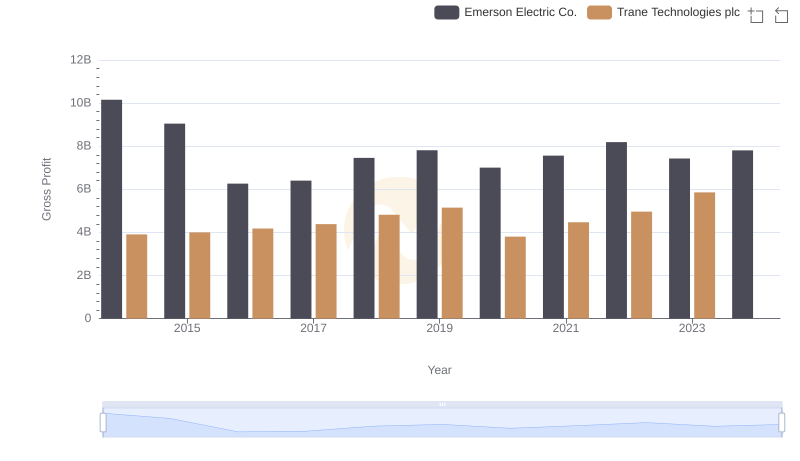
Gross Profit Trends Compared: Trane Technologies plc vs Emerson Electric Co.
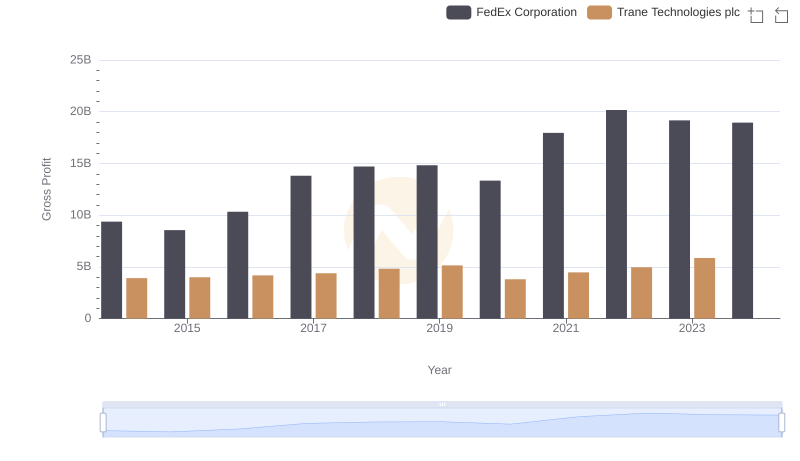
Gross Profit Trends Compared: Trane Technologies plc vs FedEx Corporation

Key Insights on Gross Profit: Trane Technologies plc vs Thomson Reuters Corporation

Gross Profit Analysis: Comparing Trane Technologies plc and Canadian National Railway Company
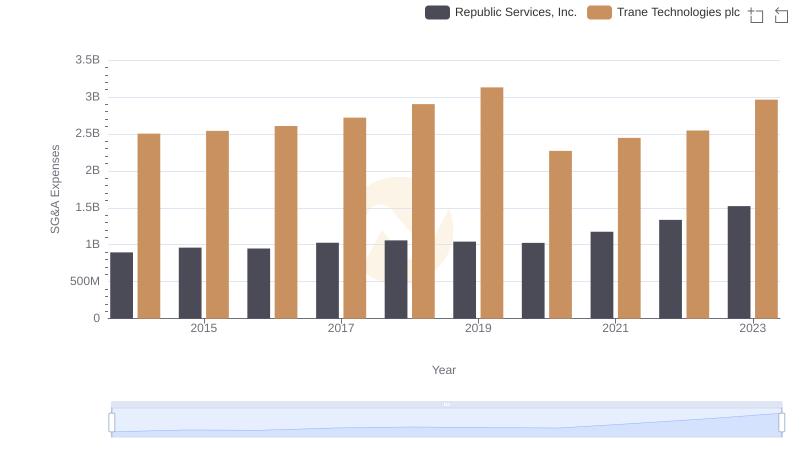
Cost Management Insights: SG&A Expenses for Trane Technologies plc and Republic Services, Inc.