| __timestamp | CSX Corporation | Trane Technologies plc |
|---|---|---|
| Wednesday, January 1, 2014 | 3613000000 | 3908600000 |
| Thursday, January 1, 2015 | 3584000000 | 3999100000 |
| Friday, January 1, 2016 | 3389000000 | 4179600000 |
| Sunday, January 1, 2017 | 3773000000 | 4386000000 |
| Monday, January 1, 2018 | 4773000000 | 4820600000 |
| Tuesday, January 1, 2019 | 4874000000 | 5147400000 |
| Wednesday, January 1, 2020 | 4362000000 | 3803400000 |
| Friday, January 1, 2021 | 5140000000 | 4469600000 |
| Saturday, January 1, 2022 | 5785000000 | 4964800000 |
| Sunday, January 1, 2023 | 5527000000 | 5857200000 |
| Monday, January 1, 2024 | 7080500000 |
Unleashing the power of data
In the ever-evolving landscape of American industry, the financial performance of companies like Trane Technologies plc and CSX Corporation offers a fascinating glimpse into their strategic prowess. Over the past decade, from 2014 to 2023, both companies have demonstrated resilience and growth in their gross profits, albeit with distinct trajectories.
Trane Technologies, a leader in climate solutions, saw its gross profit rise by approximately 50% from 2014 to 2023, peaking in 2023 with a remarkable 5.86 billion USD. Meanwhile, CSX Corporation, a major player in the transportation sector, experienced a 53% increase in gross profit over the same period, reaching a high of 5.79 billion USD in 2022.
These trends underscore the dynamic nature of their respective industries, with Trane Technologies capitalizing on sustainability trends and CSX benefiting from increased demand for freight transportation. As we look to the future, these companies' financial trajectories will be pivotal in shaping their competitive landscapes.
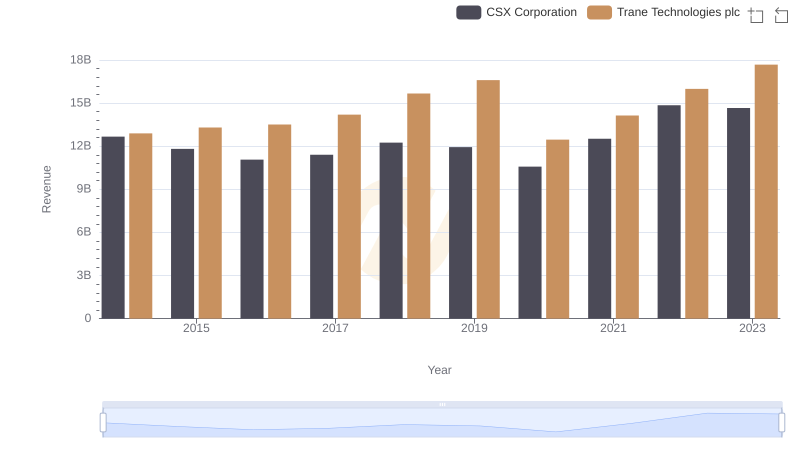
Breaking Down Revenue Trends: Trane Technologies plc vs CSX Corporation
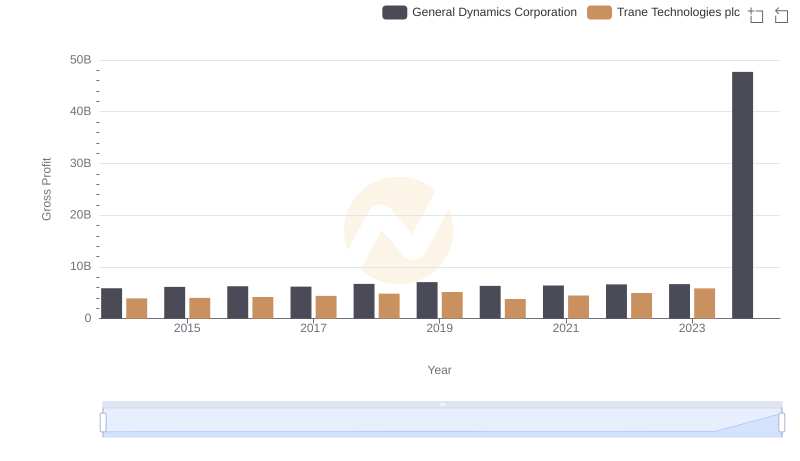
Trane Technologies plc vs General Dynamics Corporation: A Gross Profit Performance Breakdown
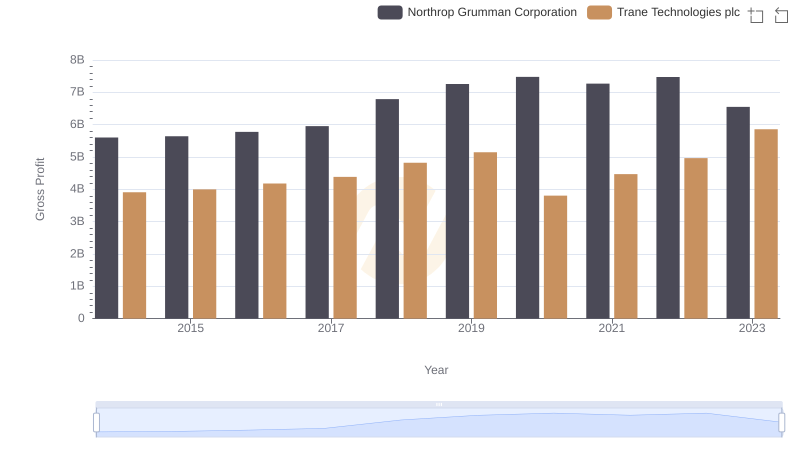
Trane Technologies plc and Northrop Grumman Corporation: A Detailed Gross Profit Analysis
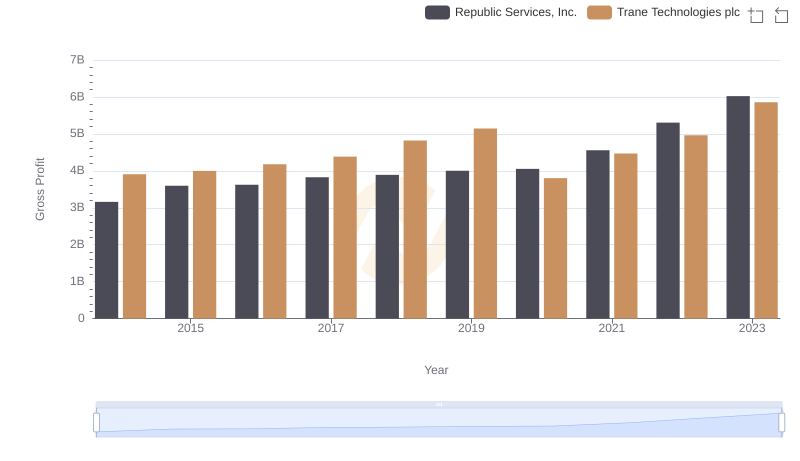
Key Insights on Gross Profit: Trane Technologies plc vs Republic Services, Inc.
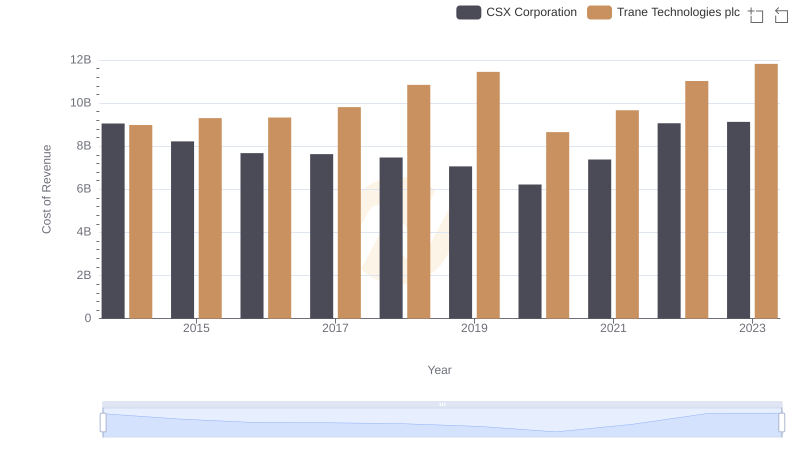
Cost of Revenue Trends: Trane Technologies plc vs CSX Corporation
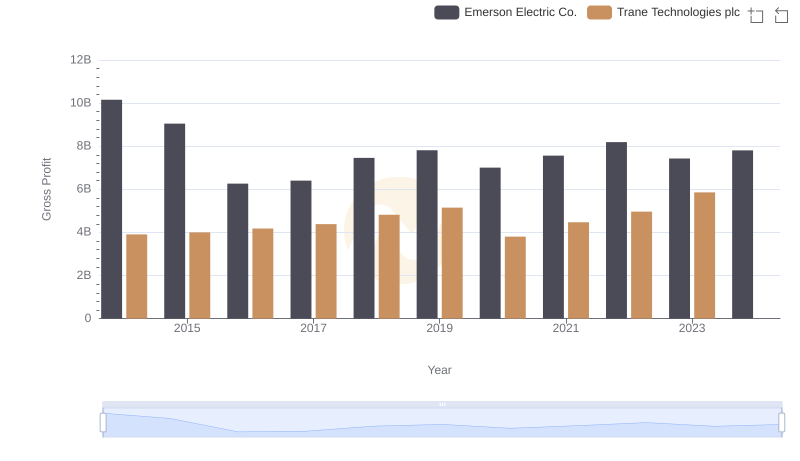
Gross Profit Trends Compared: Trane Technologies plc vs Emerson Electric Co.
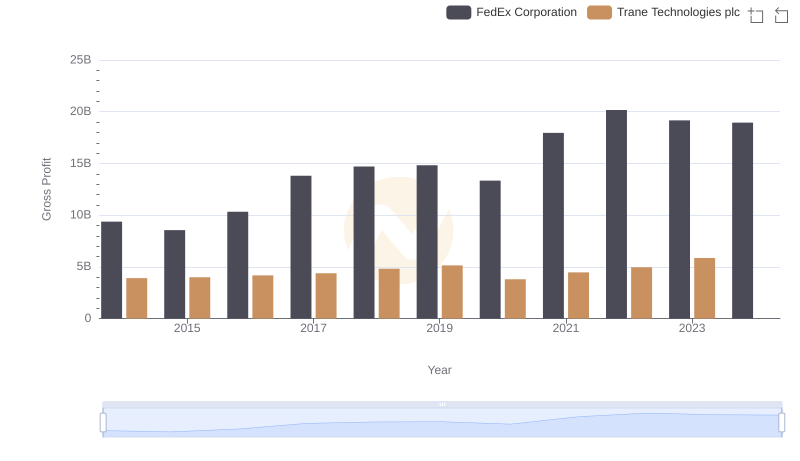
Gross Profit Trends Compared: Trane Technologies plc vs FedEx Corporation

Key Insights on Gross Profit: Trane Technologies plc vs Thomson Reuters Corporation

Gross Profit Analysis: Comparing Trane Technologies plc and Canadian National Railway Company
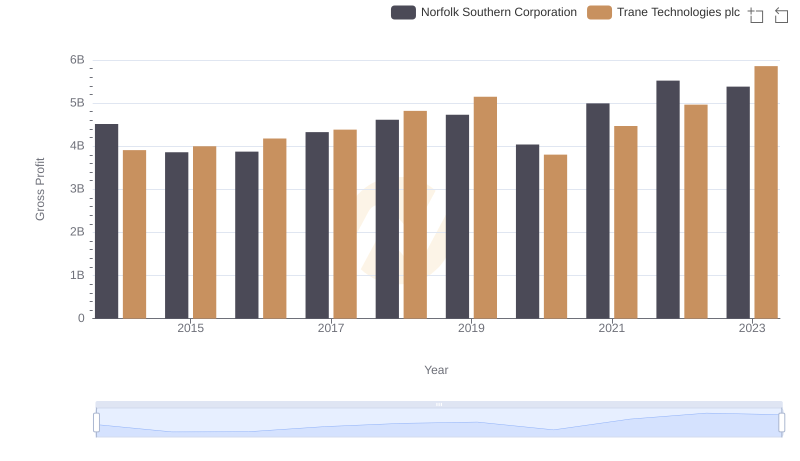
Trane Technologies plc and Norfolk Southern Corporation: A Detailed Gross Profit Analysis
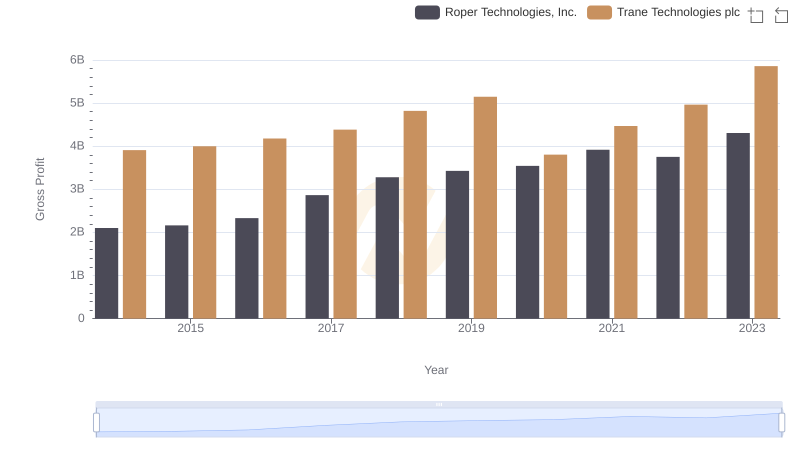
Trane Technologies plc vs Roper Technologies, Inc.: A Gross Profit Performance Breakdown
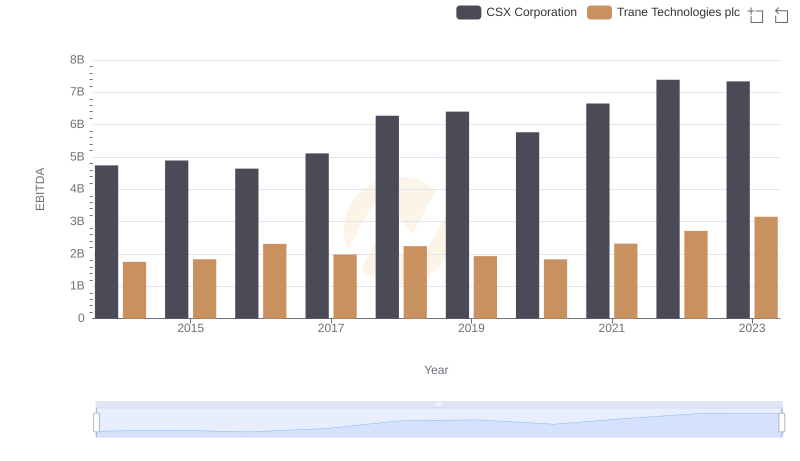
EBITDA Performance Review: Trane Technologies plc vs CSX Corporation