| __timestamp | General Dynamics Corporation | Trane Technologies plc |
|---|---|---|
| Wednesday, January 1, 2014 | 5873000000 | 3908600000 |
| Thursday, January 1, 2015 | 6130000000 | 3999100000 |
| Friday, January 1, 2016 | 6249000000 | 4179600000 |
| Sunday, January 1, 2017 | 6187000000 | 4386000000 |
| Monday, January 1, 2018 | 6715000000 | 4820600000 |
| Tuesday, January 1, 2019 | 7059000000 | 5147400000 |
| Wednesday, January 1, 2020 | 6325000000 | 3803400000 |
| Friday, January 1, 2021 | 6408000000 | 4469600000 |
| Saturday, January 1, 2022 | 6622000000 | 4964800000 |
| Sunday, January 1, 2023 | 6672000000 | 5857200000 |
| Monday, January 1, 2024 | 7364000000 | 7080500000 |
Igniting the spark of knowledge
In the ever-evolving landscape of industrial giants, Trane Technologies plc and General Dynamics Corporation have carved distinct paths in their financial journeys. Over the past decade, from 2014 to 2023, these two companies have showcased intriguing trends in their gross profit performance.
General Dynamics has demonstrated a consistent upward trajectory, with gross profits growing by approximately 14% from 2014 to 2023. The company reached its peak in 2024, with a remarkable surge, although data for Trane Technologies in 2024 remains unavailable.
Trane Technologies, while starting with a lower gross profit, has shown resilience and growth, achieving a 50% increase by 2023. This growth highlights its strategic adaptability in a competitive market.
The data underscores the dynamic nature of industrial competition, with both companies showcasing unique strengths and growth patterns.
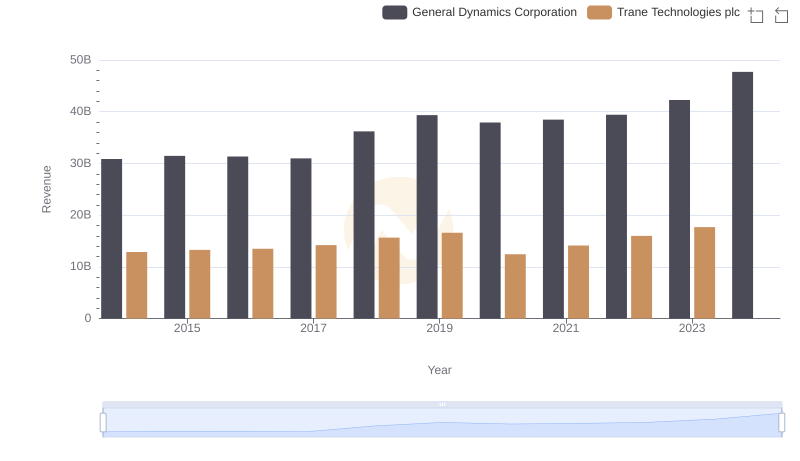
Trane Technologies plc vs General Dynamics Corporation: Annual Revenue Growth Compared
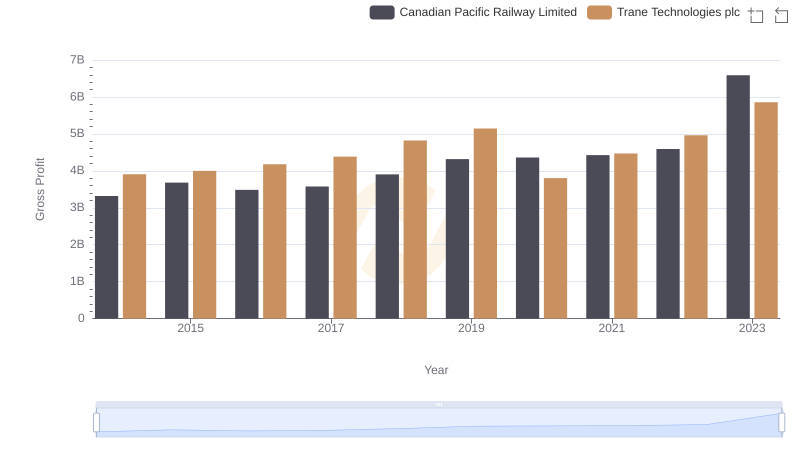
Gross Profit Trends Compared: Trane Technologies plc vs Canadian Pacific Railway Limited
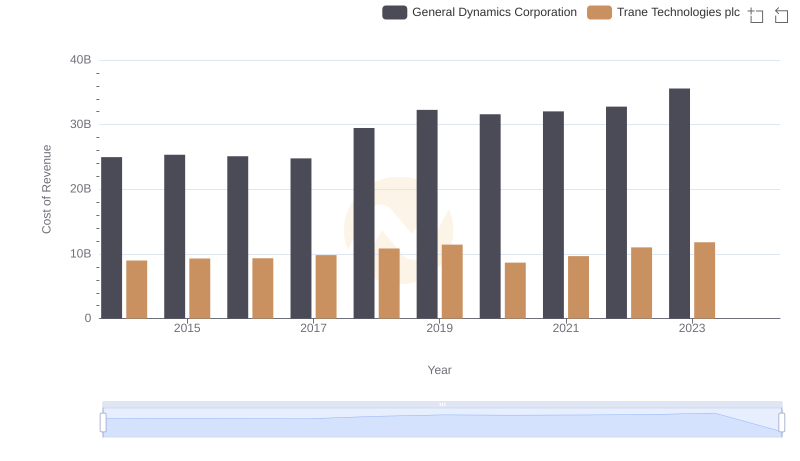
Cost of Revenue Trends: Trane Technologies plc vs General Dynamics Corporation
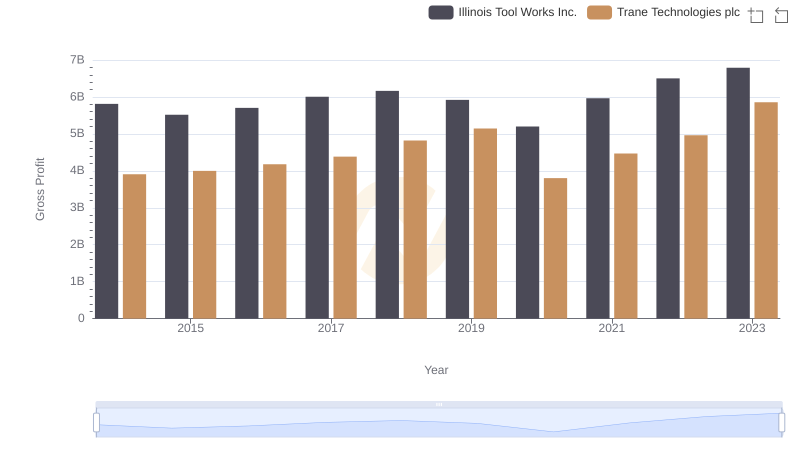
Trane Technologies plc and Illinois Tool Works Inc.: A Detailed Gross Profit Analysis
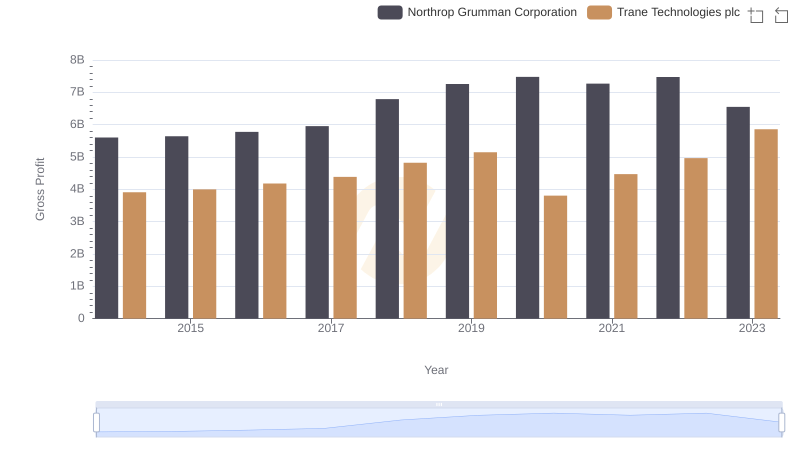
Trane Technologies plc and Northrop Grumman Corporation: A Detailed Gross Profit Analysis
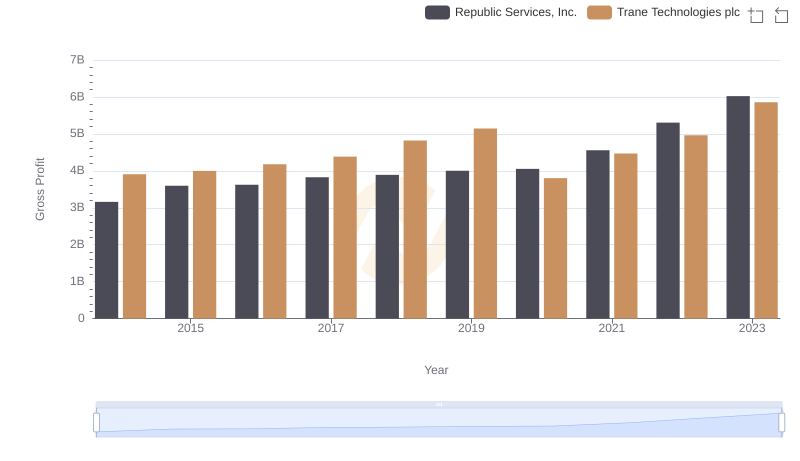
Key Insights on Gross Profit: Trane Technologies plc vs Republic Services, Inc.
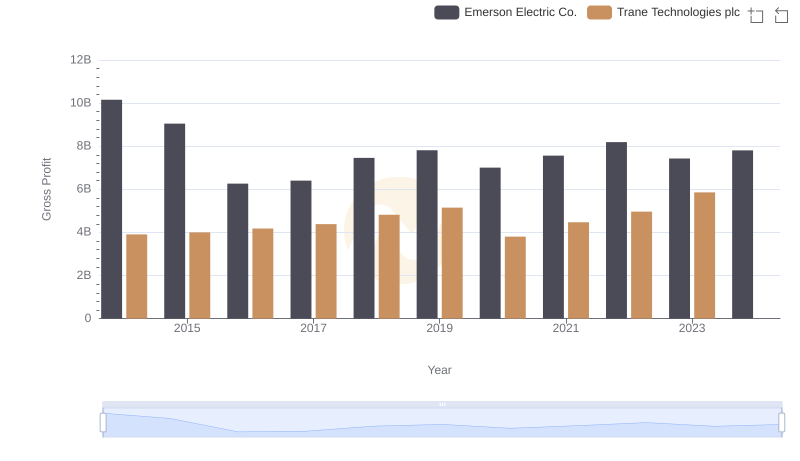
Gross Profit Trends Compared: Trane Technologies plc vs Emerson Electric Co.
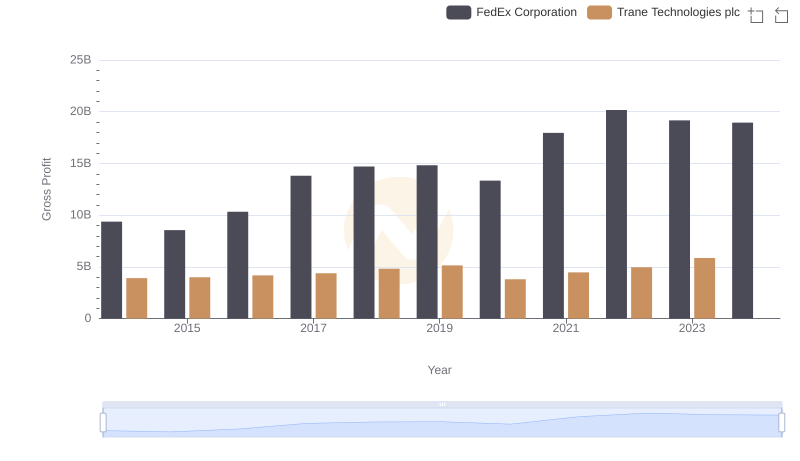
Gross Profit Trends Compared: Trane Technologies plc vs FedEx Corporation
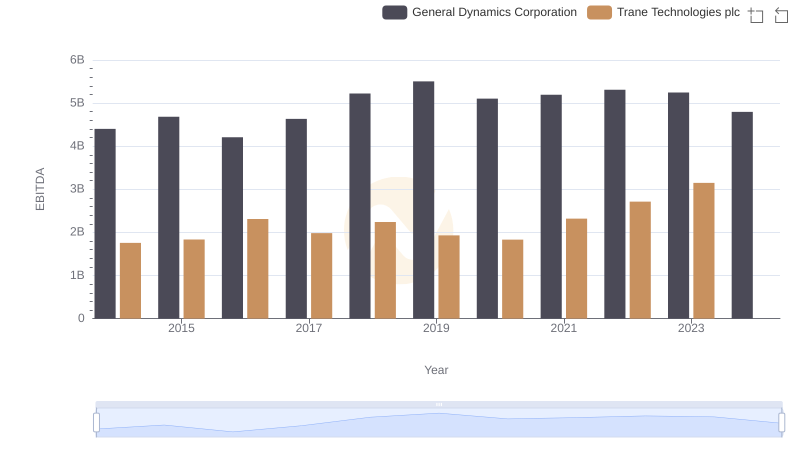
Professional EBITDA Benchmarking: Trane Technologies plc vs General Dynamics Corporation