| __timestamp | Jacobs Engineering Group Inc. | Parker-Hannifin Corporation |
|---|---|---|
| Wednesday, January 1, 2014 | 2073784000 | 3027744000 |
| Thursday, January 1, 2015 | 1968338000 | 3056499000 |
| Friday, January 1, 2016 | 1767831000 | 2537369000 |
| Sunday, January 1, 2017 | 1772252000 | 2840350000 |
| Monday, January 1, 2018 | 2828370000 | 3539551000 |
| Tuesday, January 1, 2019 | 2477028000 | 3616840000 |
| Wednesday, January 1, 2020 | 2586668000 | 3409002000 |
| Friday, January 1, 2021 | 3043772000 | 3897960000 |
| Saturday, January 1, 2022 | 3327040000 | 4474341000 |
| Sunday, January 1, 2023 | 3473315000 | 6429302000 |
| Monday, January 1, 2024 | 2832756000 | 7127790000 |
Unlocking the unknown
In the ever-evolving landscape of industrial giants, Parker-Hannifin Corporation and Jacobs Engineering Group Inc. have carved out significant niches. Over the past decade, Parker-Hannifin has consistently outperformed Jacobs Engineering in terms of gross profit, showcasing a robust growth trajectory. From 2014 to 2023, Parker-Hannifin's gross profit surged by approximately 112%, peaking in 2023 with a remarkable 6.43 billion USD. In contrast, Jacobs Engineering experienced a more modest growth of around 67% during the same period, reaching its highest gross profit of 3.47 billion USD in 2023.
This comparison highlights Parker-Hannifin's strategic prowess in capitalizing on market opportunities, while Jacobs Engineering continues to hold its ground with steady growth. As we look to the future, these trends offer valuable insights into the competitive dynamics of the industrial sector.
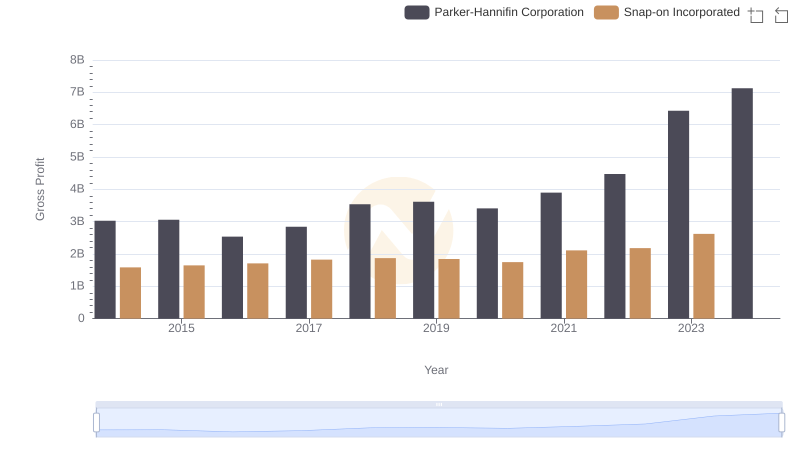
Gross Profit Trends Compared: Parker-Hannifin Corporation vs Snap-on Incorporated
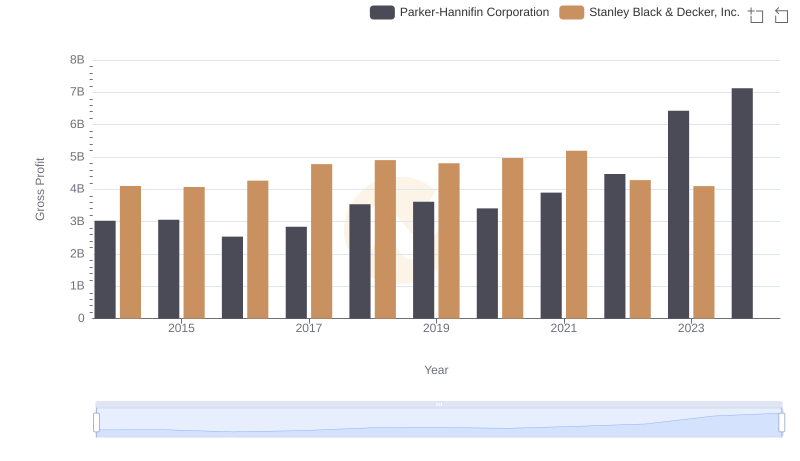
Parker-Hannifin Corporation and Stanley Black & Decker, Inc.: A Detailed Gross Profit Analysis
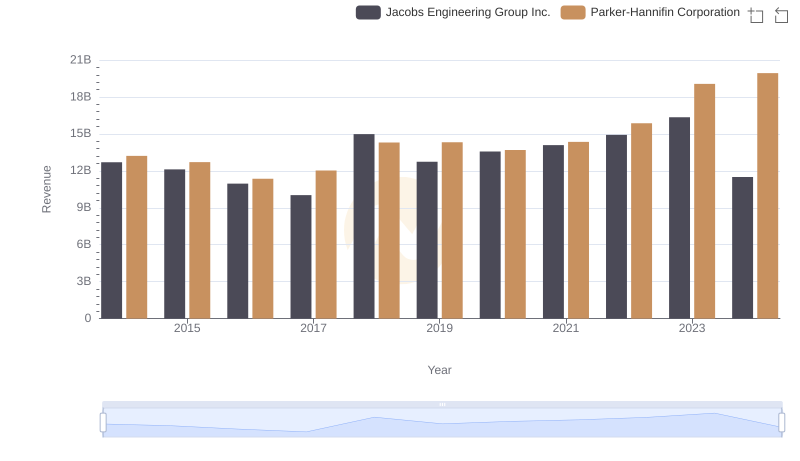
Parker-Hannifin Corporation or Jacobs Engineering Group Inc.: Who Leads in Yearly Revenue?
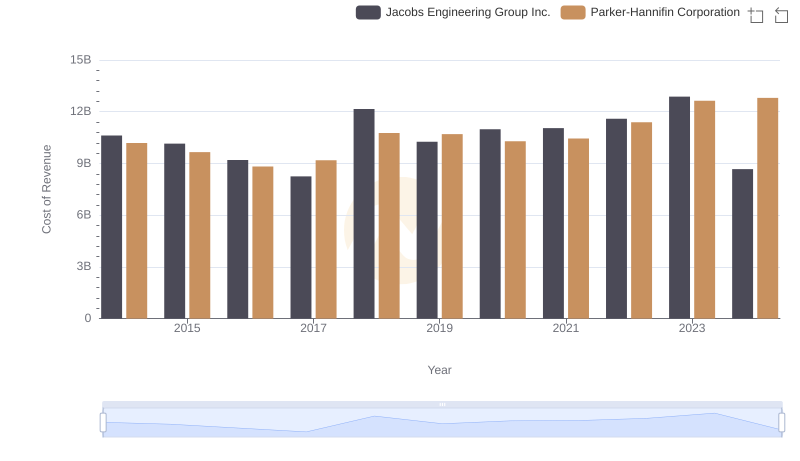
Parker-Hannifin Corporation vs Jacobs Engineering Group Inc.: Efficiency in Cost of Revenue Explored
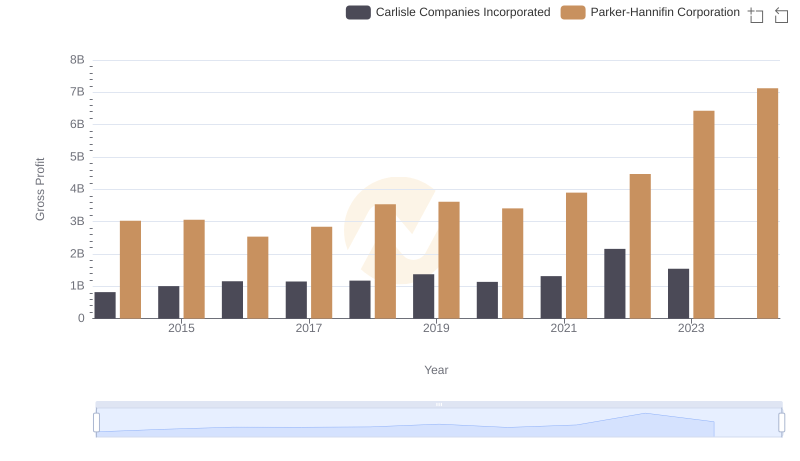
Gross Profit Trends Compared: Parker-Hannifin Corporation vs Carlisle Companies Incorporated
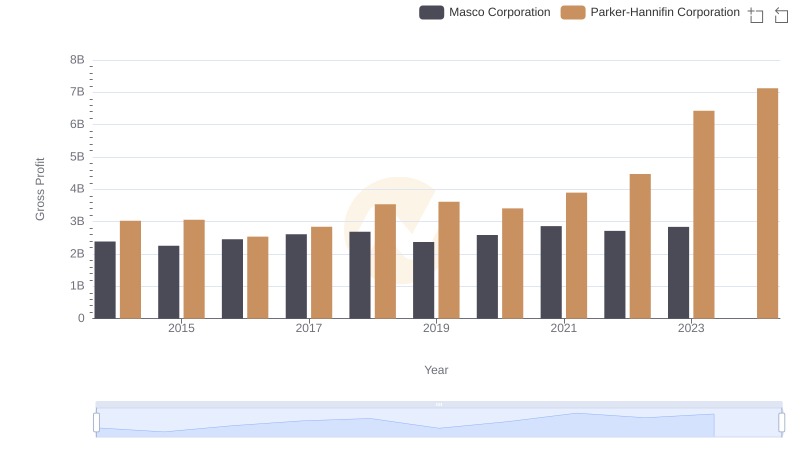
Who Generates Higher Gross Profit? Parker-Hannifin Corporation or Masco Corporation
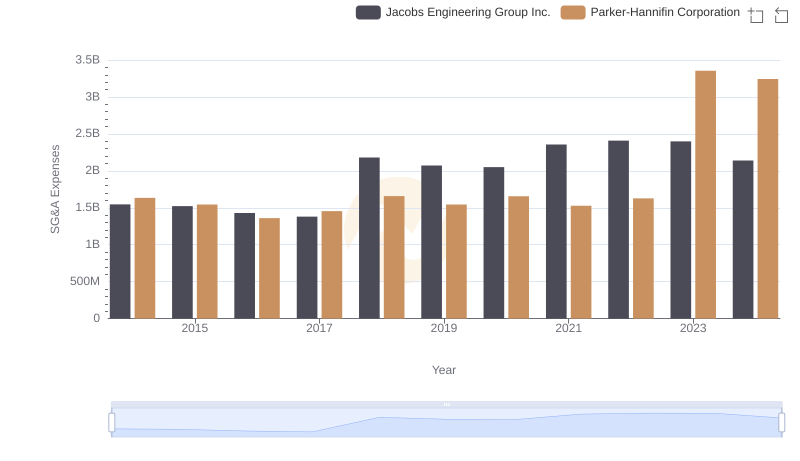
Breaking Down SG&A Expenses: Parker-Hannifin Corporation vs Jacobs Engineering Group Inc.
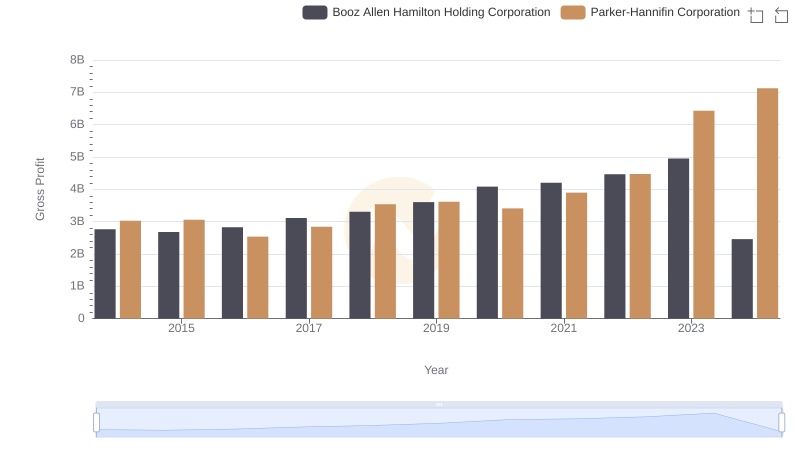
Key Insights on Gross Profit: Parker-Hannifin Corporation vs Booz Allen Hamilton Holding Corporation
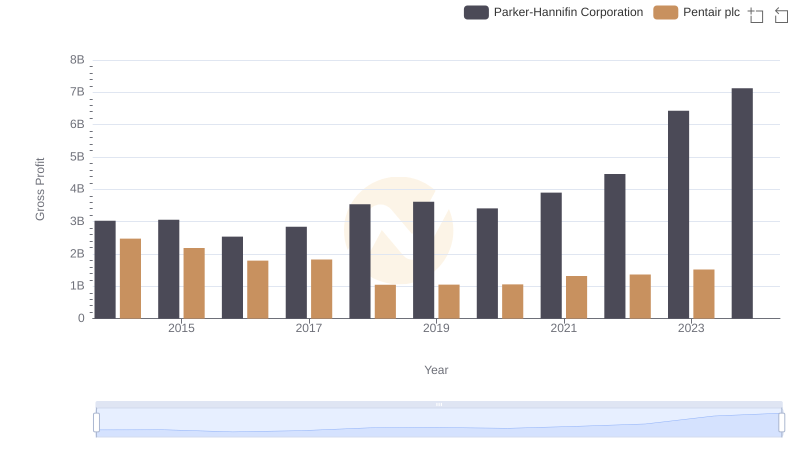
Parker-Hannifin Corporation vs Pentair plc: A Gross Profit Performance Breakdown
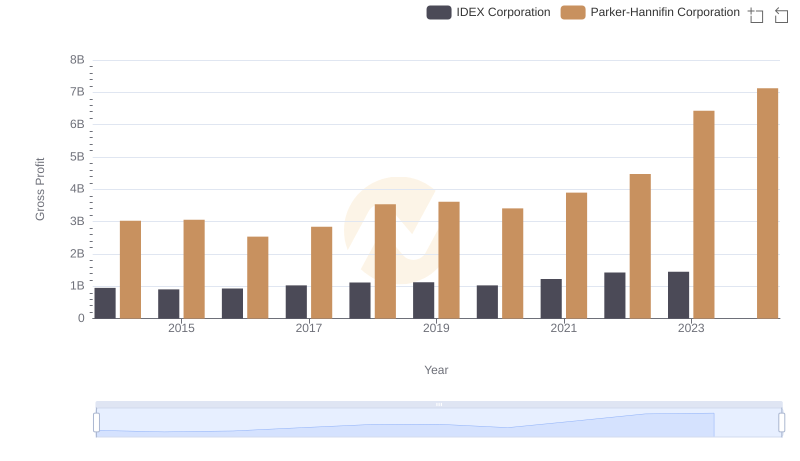
Gross Profit Analysis: Comparing Parker-Hannifin Corporation and IDEX Corporation
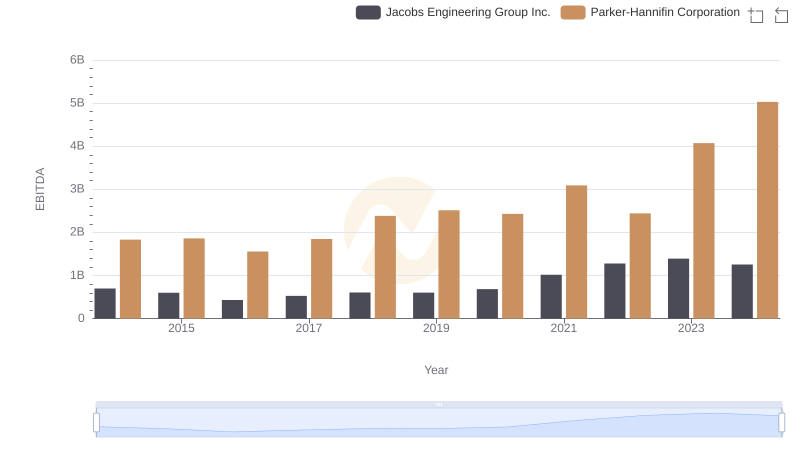
EBITDA Metrics Evaluated: Parker-Hannifin Corporation vs Jacobs Engineering Group Inc.