| __timestamp | Parker-Hannifin Corporation | Watsco, Inc. |
|---|---|---|
| Wednesday, January 1, 2014 | 3027744000 | 956402000 |
| Thursday, January 1, 2015 | 3056499000 | 1007357000 |
| Friday, January 1, 2016 | 2537369000 | 1034584000 |
| Sunday, January 1, 2017 | 2840350000 | 1065659000 |
| Monday, January 1, 2018 | 3539551000 | 1120252000 |
| Tuesday, January 1, 2019 | 3616840000 | 1156956000 |
| Wednesday, January 1, 2020 | 3409002000 | 1222821000 |
| Friday, January 1, 2021 | 3897960000 | 1667545000 |
| Saturday, January 1, 2022 | 4474341000 | 2030289000 |
| Sunday, January 1, 2023 | 6429302000 | 1992140000 |
| Monday, January 1, 2024 | 7127790000 | 2044713000 |
Unveiling the hidden dimensions of data
In the ever-evolving landscape of industrial manufacturing and distribution, Parker-Hannifin Corporation and Watsco, Inc. have emerged as formidable players. Over the past decade, Parker-Hannifin has demonstrated a robust growth trajectory, with its gross profit surging by approximately 135% from 2014 to 2023. This growth is particularly notable in 2023, where the company achieved a remarkable 44% increase compared to the previous year.
Conversely, Watsco, Inc. has shown steady progress, with its gross profit increasing by about 108% from 2014 to 2022. However, data for 2024 remains elusive, leaving room for speculation on its future performance. This comparison not only highlights the resilience and strategic prowess of these companies but also underscores the dynamic nature of the industrial sector. As we look to the future, the question remains: how will these giants continue to adapt and thrive?
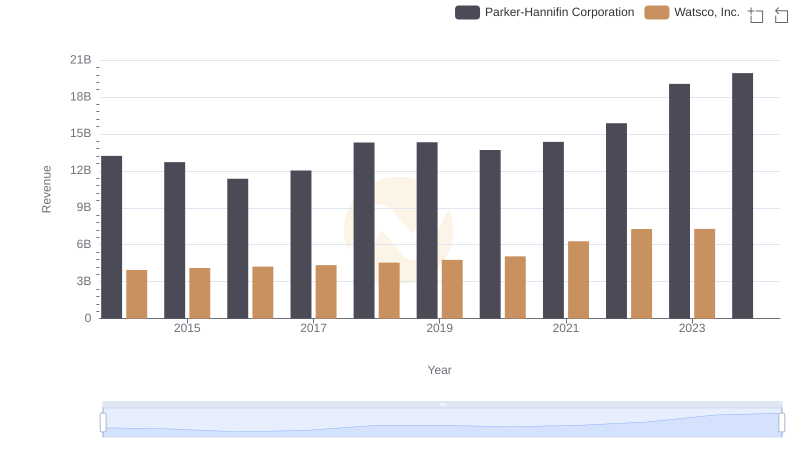
Who Generates More Revenue? Parker-Hannifin Corporation or Watsco, Inc.
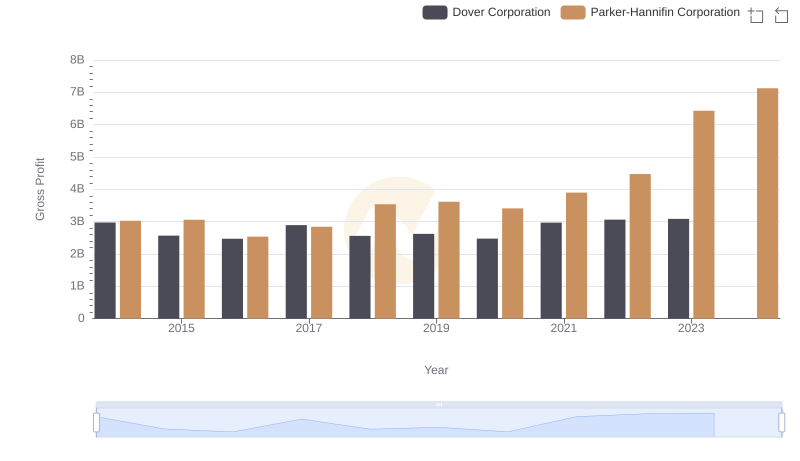
Gross Profit Comparison: Parker-Hannifin Corporation and Dover Corporation Trends
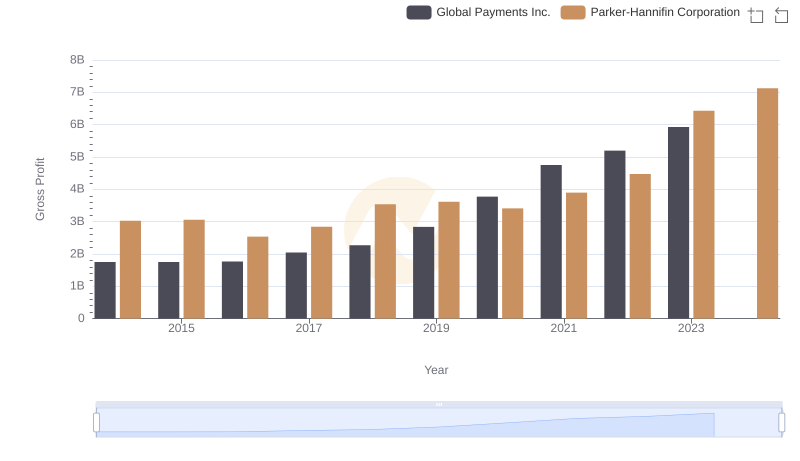
Gross Profit Comparison: Parker-Hannifin Corporation and Global Payments Inc. Trends
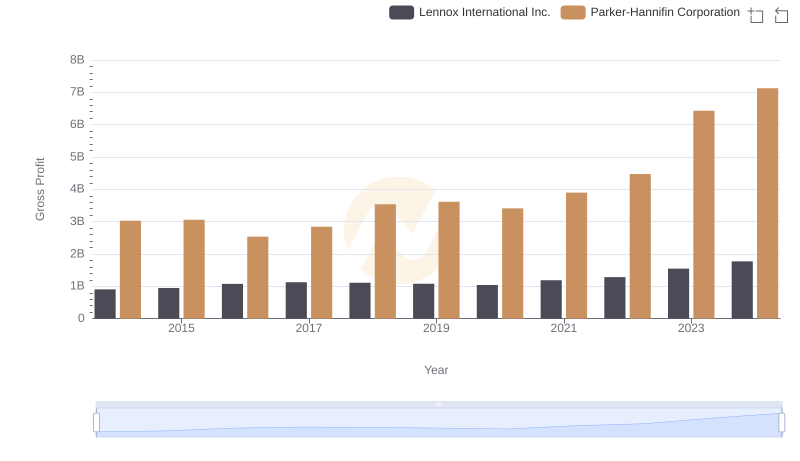
Gross Profit Comparison: Parker-Hannifin Corporation and Lennox International Inc. Trends
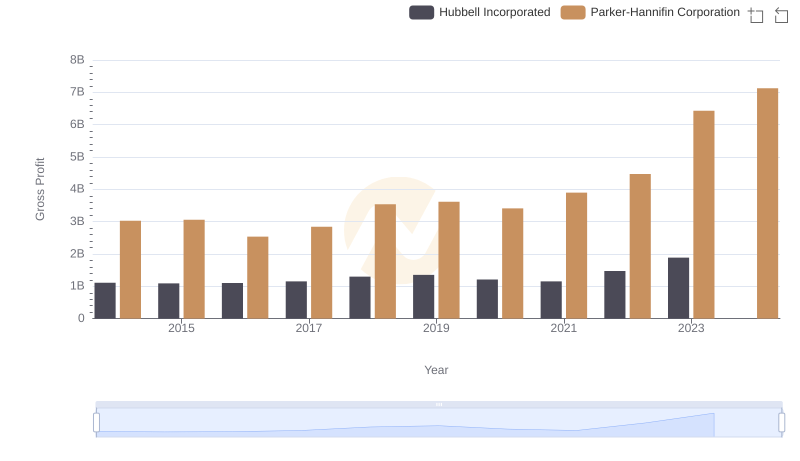
Gross Profit Comparison: Parker-Hannifin Corporation and Hubbell Incorporated Trends
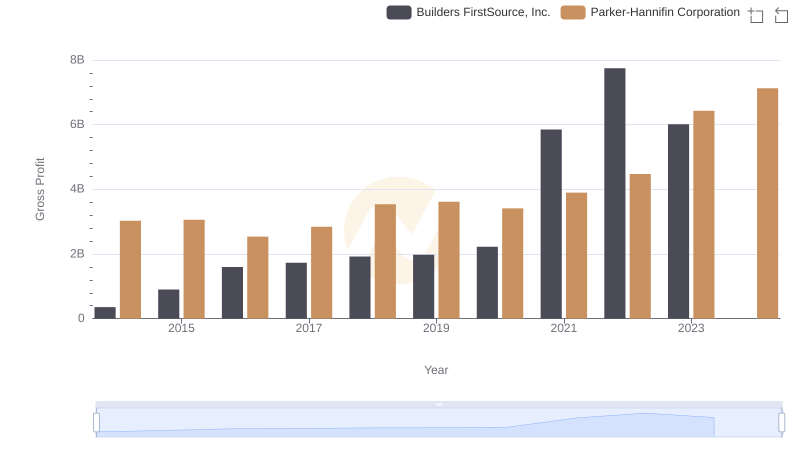
Parker-Hannifin Corporation and Builders FirstSource, Inc.: A Detailed Gross Profit Analysis
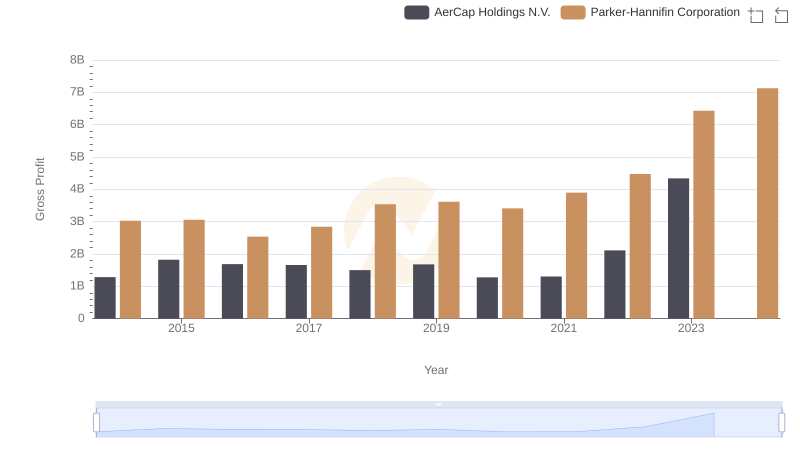
Gross Profit Trends Compared: Parker-Hannifin Corporation vs AerCap Holdings N.V.
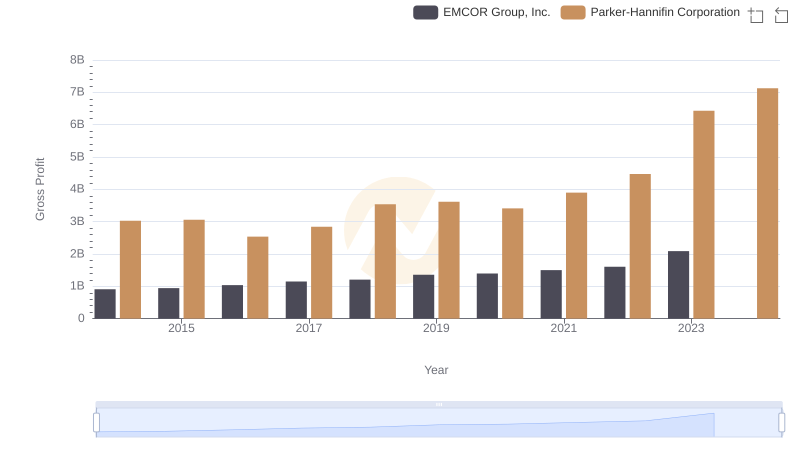
Who Generates Higher Gross Profit? Parker-Hannifin Corporation or EMCOR Group, Inc.
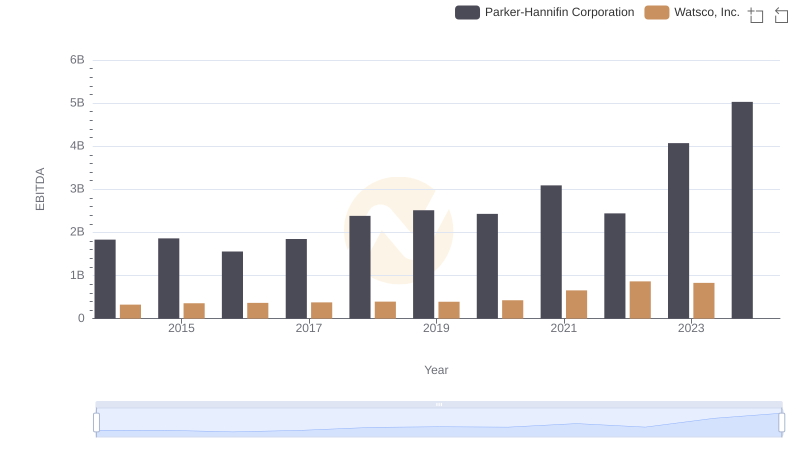
EBITDA Analysis: Evaluating Parker-Hannifin Corporation Against Watsco, Inc.