| __timestamp | EMCOR Group, Inc. | Parker-Hannifin Corporation |
|---|---|---|
| Wednesday, January 1, 2014 | 907246000 | 3027744000 |
| Thursday, January 1, 2015 | 944479000 | 3056499000 |
| Friday, January 1, 2016 | 1037862000 | 2537369000 |
| Sunday, January 1, 2017 | 1147012000 | 2840350000 |
| Monday, January 1, 2018 | 1205453000 | 3539551000 |
| Tuesday, January 1, 2019 | 1355868000 | 3616840000 |
| Wednesday, January 1, 2020 | 1395382000 | 3409002000 |
| Friday, January 1, 2021 | 1501737000 | 3897960000 |
| Saturday, January 1, 2022 | 1603594000 | 4474341000 |
| Sunday, January 1, 2023 | 2089339000 | 6429302000 |
| Monday, January 1, 2024 | 7127790000 |
Unleashing insights
In the competitive landscape of industrial manufacturing and construction services, Parker-Hannifin Corporation and EMCOR Group, Inc. have emerged as formidable players. Over the past decade, Parker-Hannifin has consistently outperformed EMCOR in terms of gross profit. From 2014 to 2023, Parker-Hannifin's gross profit surged by over 110%, peaking at approximately $6.43 billion in 2023. In contrast, EMCOR's growth, while steady, was more modest, with a 130% increase, reaching around $2.09 billion in the same year.
This trend highlights Parker-Hannifin's robust market position and strategic initiatives that have propelled its financial success. Despite EMCOR's impressive growth rate, Parker-Hannifin's larger scale and diversified portfolio have given it a competitive edge. As we look to the future, the absence of data for 2024 for EMCOR suggests potential challenges or strategic shifts that could impact its trajectory.
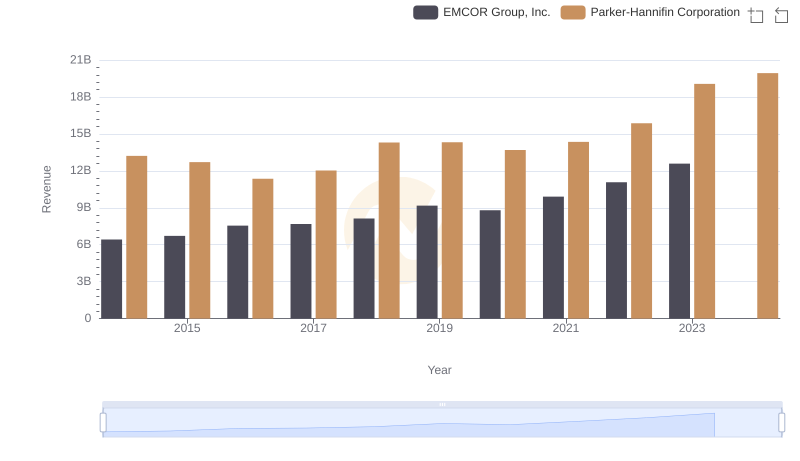
Who Generates More Revenue? Parker-Hannifin Corporation or EMCOR Group, Inc.
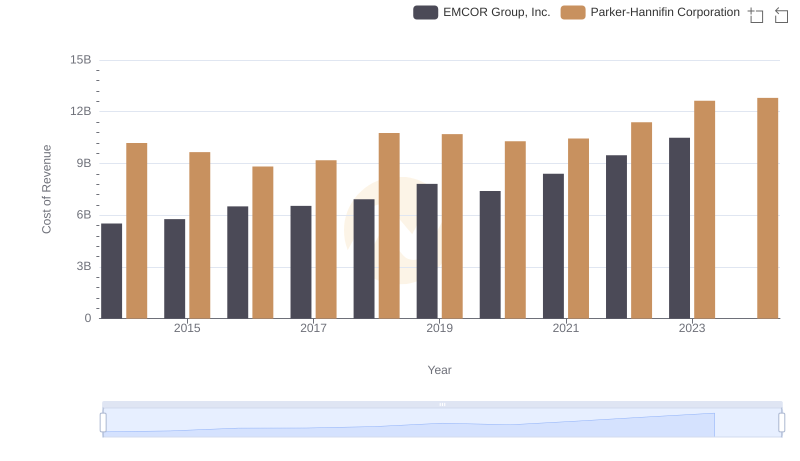
Cost Insights: Breaking Down Parker-Hannifin Corporation and EMCOR Group, Inc.'s Expenses
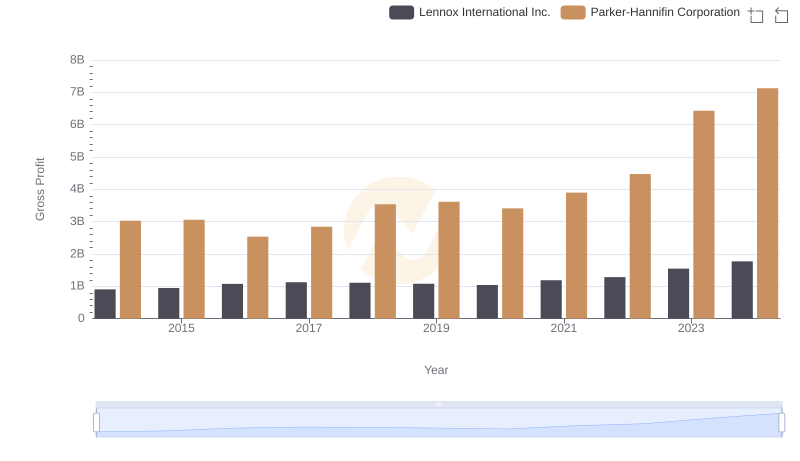
Gross Profit Comparison: Parker-Hannifin Corporation and Lennox International Inc. Trends
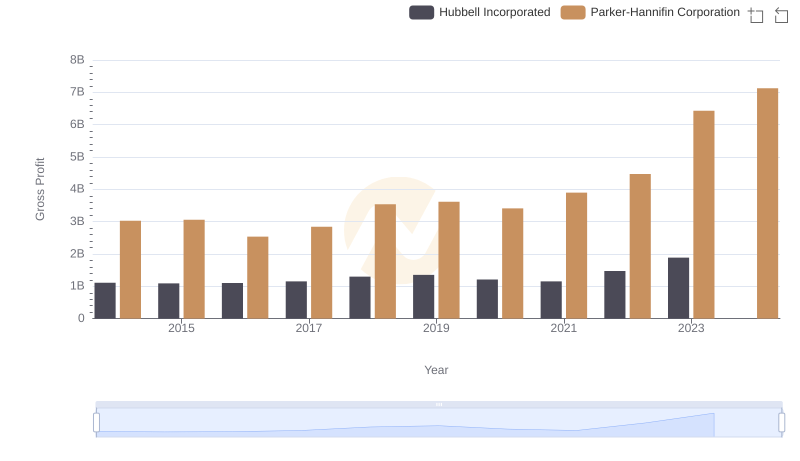
Gross Profit Comparison: Parker-Hannifin Corporation and Hubbell Incorporated Trends
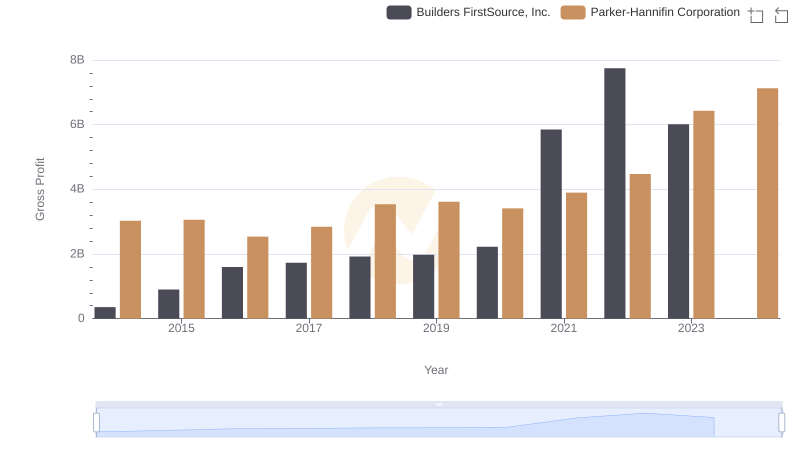
Parker-Hannifin Corporation and Builders FirstSource, Inc.: A Detailed Gross Profit Analysis
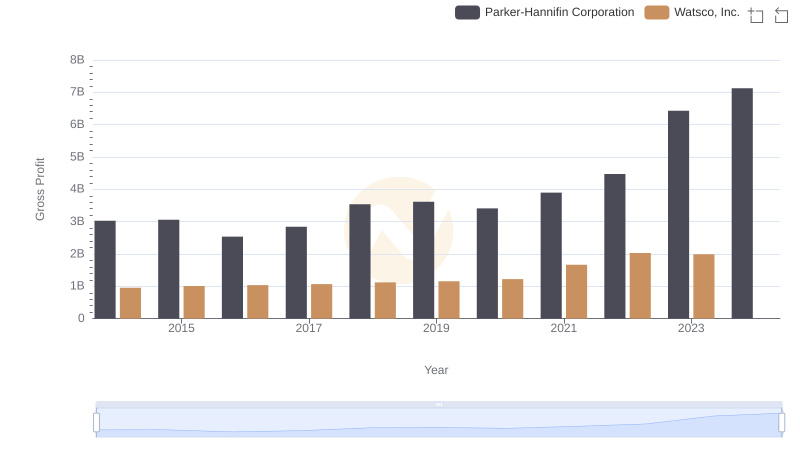
Gross Profit Comparison: Parker-Hannifin Corporation and Watsco, Inc. Trends
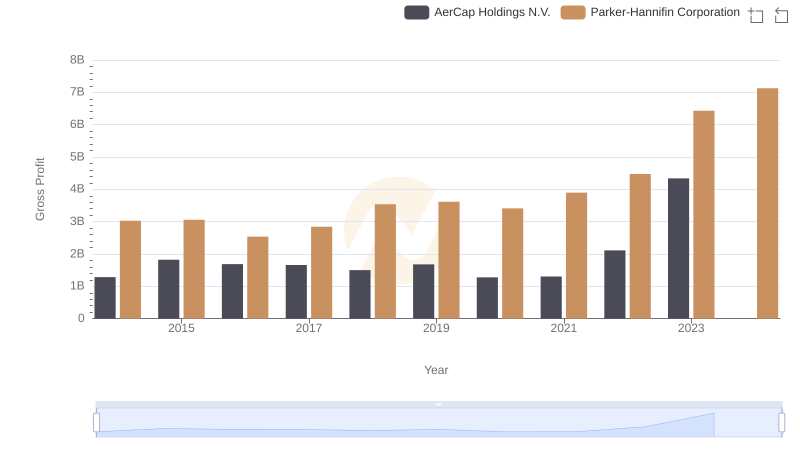
Gross Profit Trends Compared: Parker-Hannifin Corporation vs AerCap Holdings N.V.
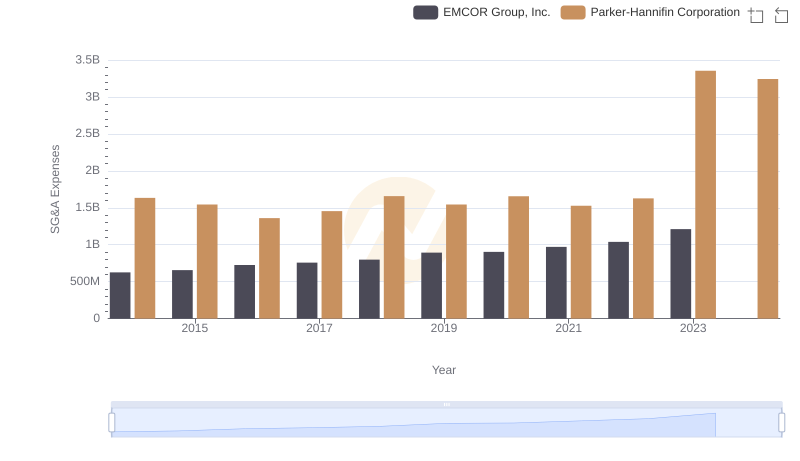
Who Optimizes SG&A Costs Better? Parker-Hannifin Corporation or EMCOR Group, Inc.
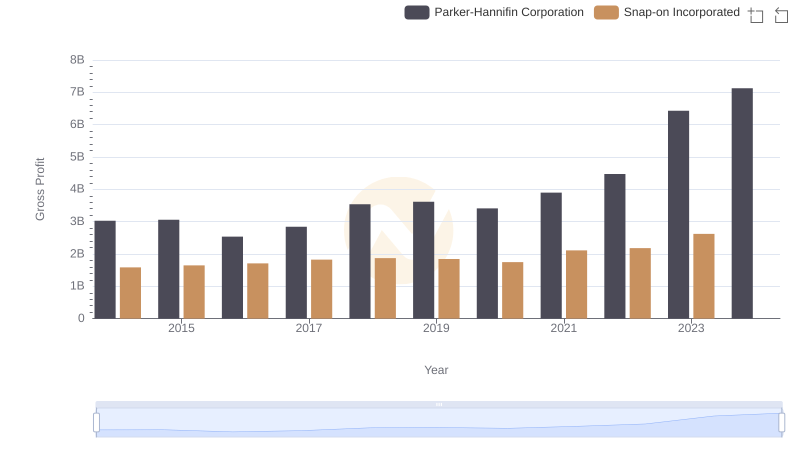
Gross Profit Trends Compared: Parker-Hannifin Corporation vs Snap-on Incorporated
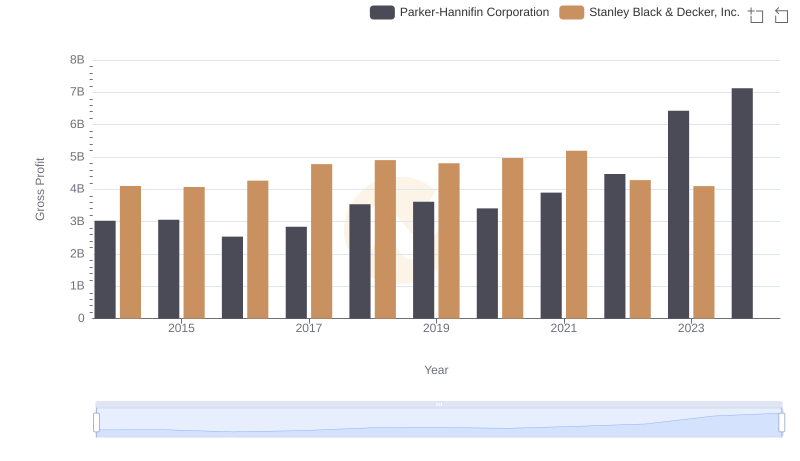
Parker-Hannifin Corporation and Stanley Black & Decker, Inc.: A Detailed Gross Profit Analysis
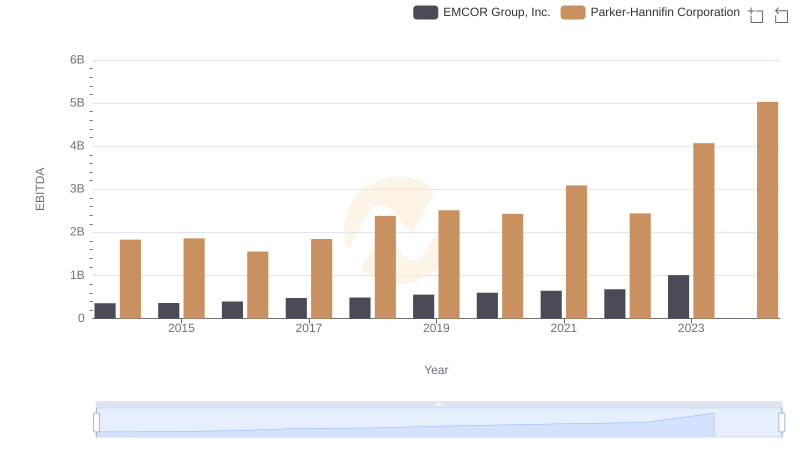
Comprehensive EBITDA Comparison: Parker-Hannifin Corporation vs EMCOR Group, Inc.