| __timestamp | Hubbell Incorporated | Parker-Hannifin Corporation |
|---|---|---|
| Wednesday, January 1, 2014 | 1109000000 | 3027744000 |
| Thursday, January 1, 2015 | 1091800000 | 3056499000 |
| Friday, January 1, 2016 | 1100700000 | 2537369000 |
| Sunday, January 1, 2017 | 1151900000 | 2840350000 |
| Monday, January 1, 2018 | 1300400000 | 3539551000 |
| Tuesday, January 1, 2019 | 1352700000 | 3616840000 |
| Wednesday, January 1, 2020 | 1209300000 | 3409002000 |
| Friday, January 1, 2021 | 1151500000 | 3897960000 |
| Saturday, January 1, 2022 | 1471600000 | 4474341000 |
| Sunday, January 1, 2023 | 1888100000 | 6429302000 |
| Monday, January 1, 2024 | 1904100000 | 7127790000 |
Infusing magic into the data realm
In the ever-evolving landscape of industrial manufacturing, Parker-Hannifin Corporation and Hubbell Incorporated have been key players. Over the past decade, Parker-Hannifin has consistently outperformed Hubbell in terms of gross profit. From 2014 to 2023, Parker-Hannifin's gross profit surged by over 110%, peaking at approximately $6.4 billion in 2023. In contrast, Hubbell's growth was more modest, with a 70% increase, reaching around $1.9 billion in the same year.
These trends highlight Parker-Hannifin's robust growth strategy and market adaptability, setting a benchmark in the industrial sector.
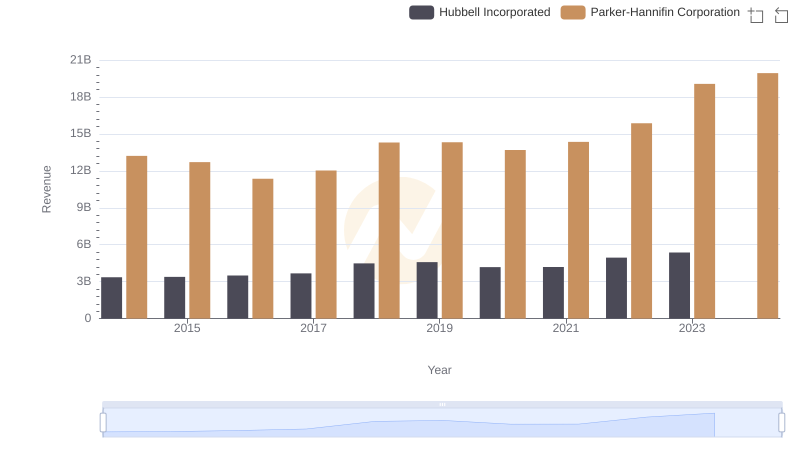
Parker-Hannifin Corporation or Hubbell Incorporated: Who Leads in Yearly Revenue?
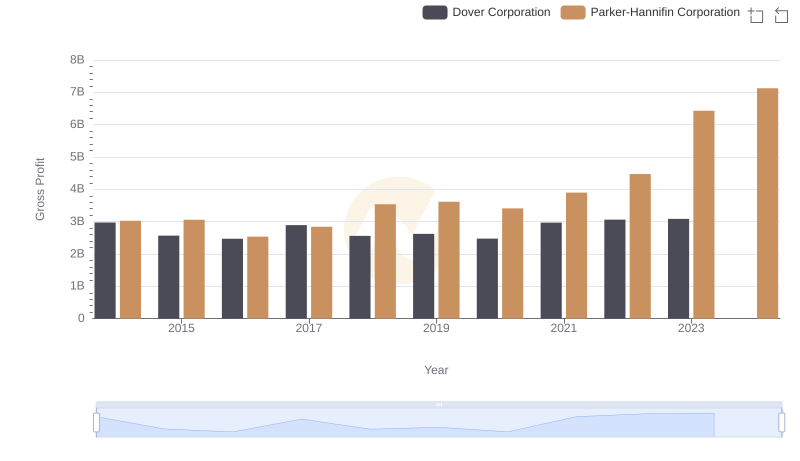
Gross Profit Comparison: Parker-Hannifin Corporation and Dover Corporation Trends
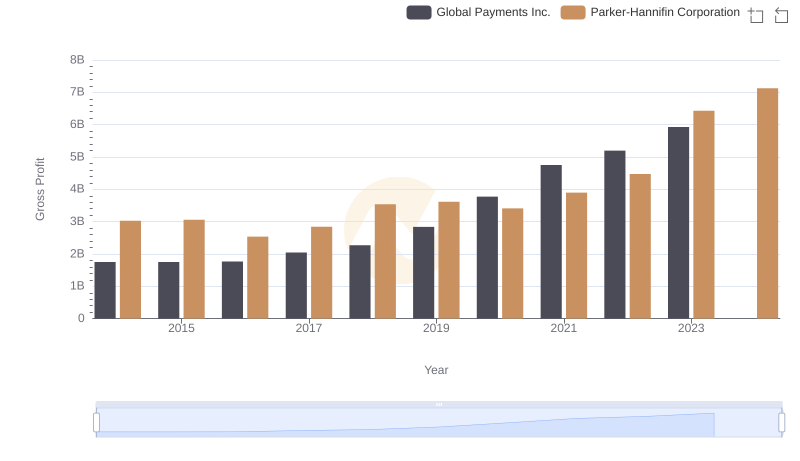
Gross Profit Comparison: Parker-Hannifin Corporation and Global Payments Inc. Trends
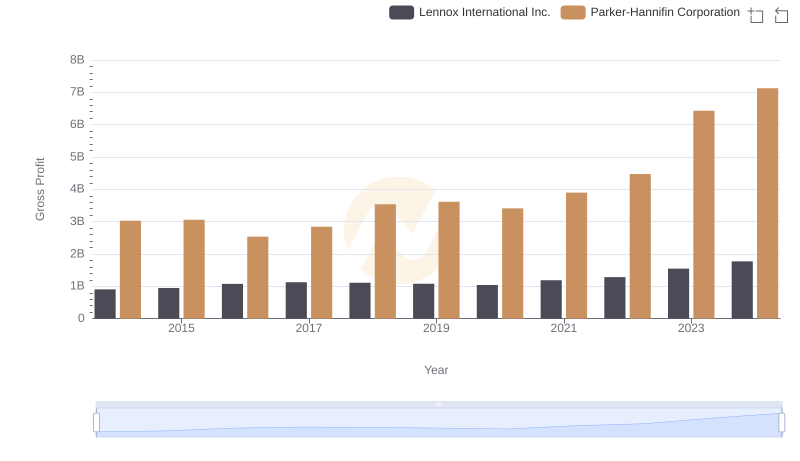
Gross Profit Comparison: Parker-Hannifin Corporation and Lennox International Inc. Trends
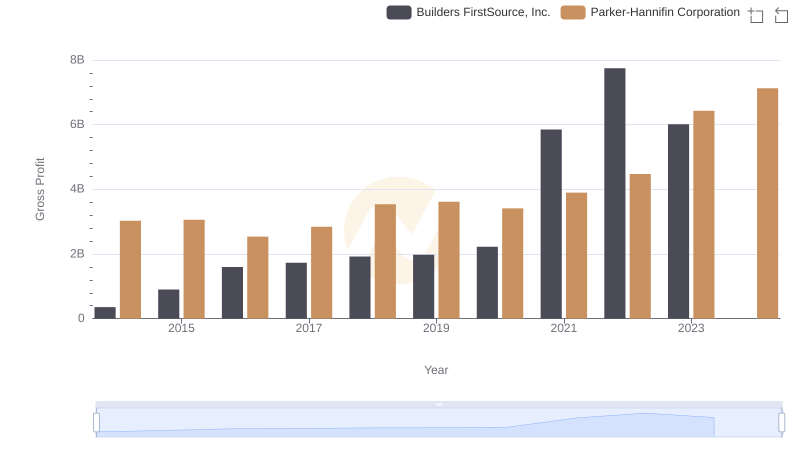
Parker-Hannifin Corporation and Builders FirstSource, Inc.: A Detailed Gross Profit Analysis
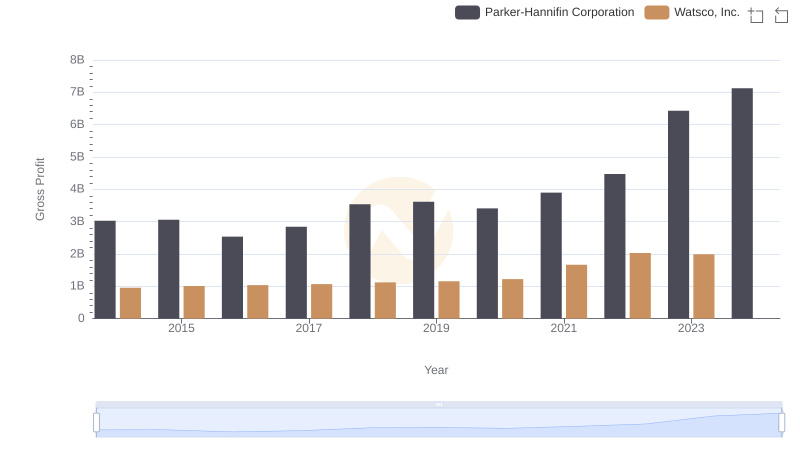
Gross Profit Comparison: Parker-Hannifin Corporation and Watsco, Inc. Trends
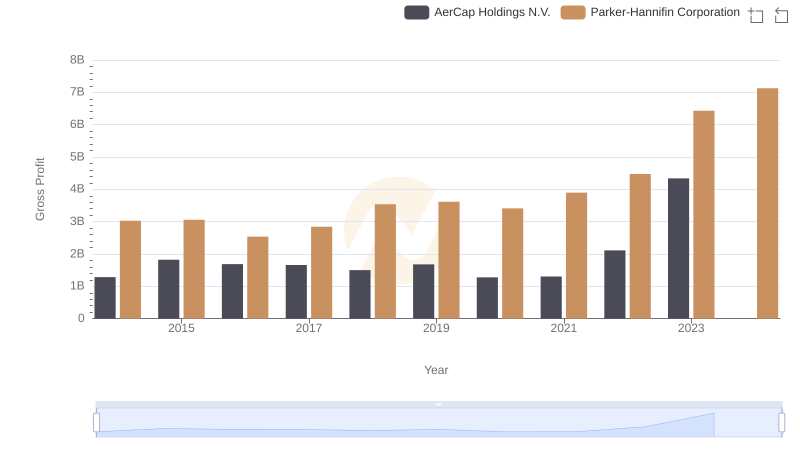
Gross Profit Trends Compared: Parker-Hannifin Corporation vs AerCap Holdings N.V.
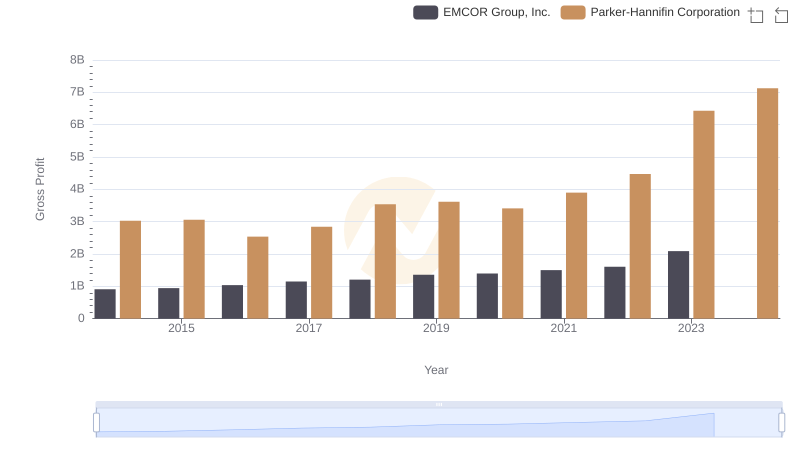
Who Generates Higher Gross Profit? Parker-Hannifin Corporation or EMCOR Group, Inc.
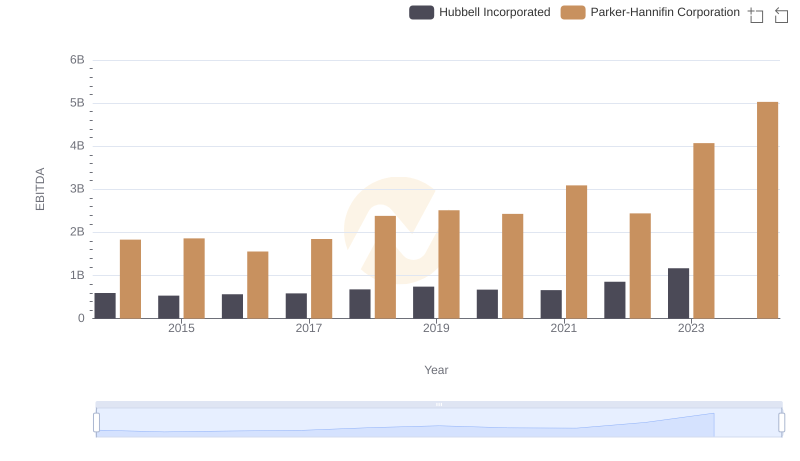
EBITDA Performance Review: Parker-Hannifin Corporation vs Hubbell Incorporated