| __timestamp | Lennox International Inc. | Nordson Corporation |
|---|---|---|
| Wednesday, January 1, 2014 | 573700000 | 577993000 |
| Thursday, January 1, 2015 | 580500000 | 596234000 |
| Friday, January 1, 2016 | 621000000 | 605068000 |
| Sunday, January 1, 2017 | 637700000 | 681299000 |
| Monday, January 1, 2018 | 608200000 | 741408000 |
| Tuesday, January 1, 2019 | 585900000 | 708990000 |
| Wednesday, January 1, 2020 | 555900000 | 693552000 |
| Friday, January 1, 2021 | 598900000 | 708953000 |
| Saturday, January 1, 2022 | 627200000 | 724176000 |
| Sunday, January 1, 2023 | 705500000 | 681244000 |
| Monday, January 1, 2024 | 730600000 | 812128000 |
Data in motion
In the ever-evolving landscape of corporate finance, understanding Selling, General, and Administrative (SG&A) expenses is crucial for evaluating a company's operational efficiency. This analysis delves into the SG&A expenses of Lennox International Inc. and Nordson Corporation from 2014 to 2024. Over this decade, Nordson Corporation consistently outpaced Lennox in SG&A spending, with an average of 10% higher expenses. Notably, in 2024, Nordson's SG&A expenses surged to 812 million, marking a 40% increase from 2014. Meanwhile, Lennox saw a 27% rise, reaching 731 million in the same year. This trend highlights Nordson's aggressive investment in administrative and sales functions, potentially fueling its growth strategy. As businesses navigate the complexities of the modern market, such insights into SG&A trends offer valuable perspectives on strategic priorities and financial health.
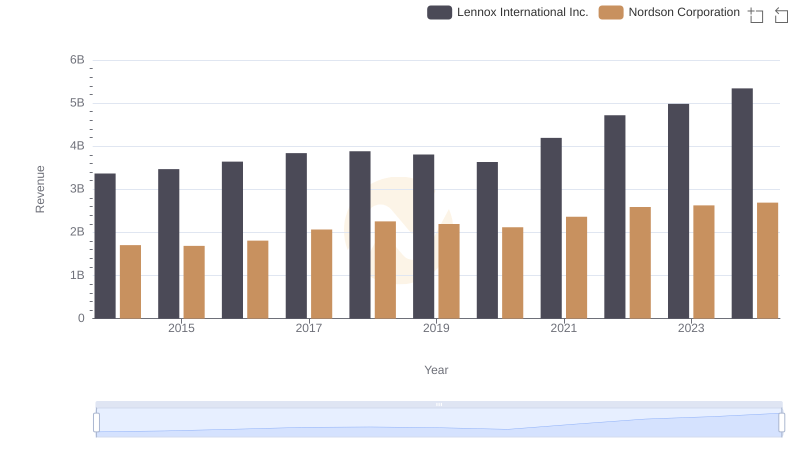
Revenue Showdown: Lennox International Inc. vs Nordson Corporation
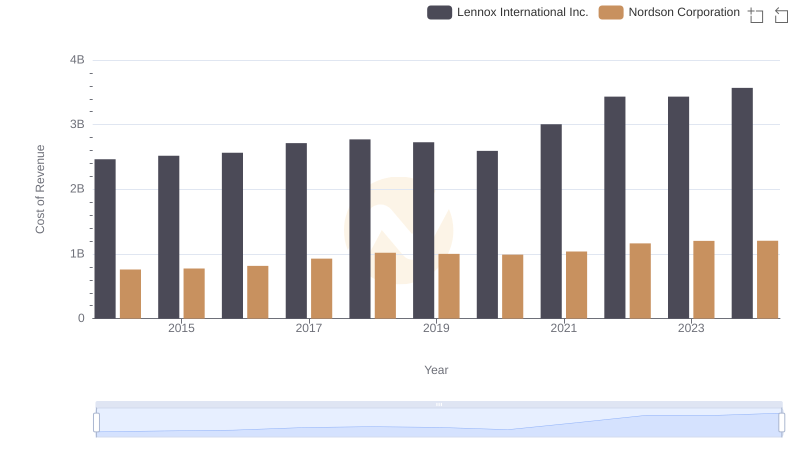
Cost of Revenue: Key Insights for Lennox International Inc. and Nordson Corporation

Lennox International Inc. vs Saia, Inc.: SG&A Expense Trends
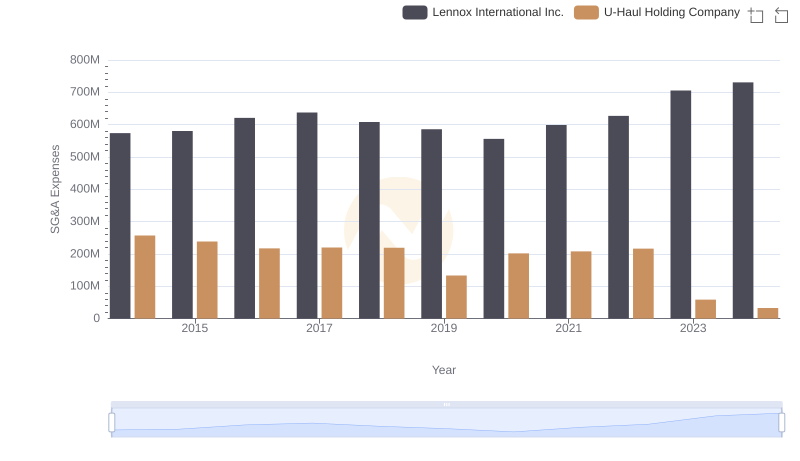
Selling, General, and Administrative Costs: Lennox International Inc. vs U-Haul Holding Company
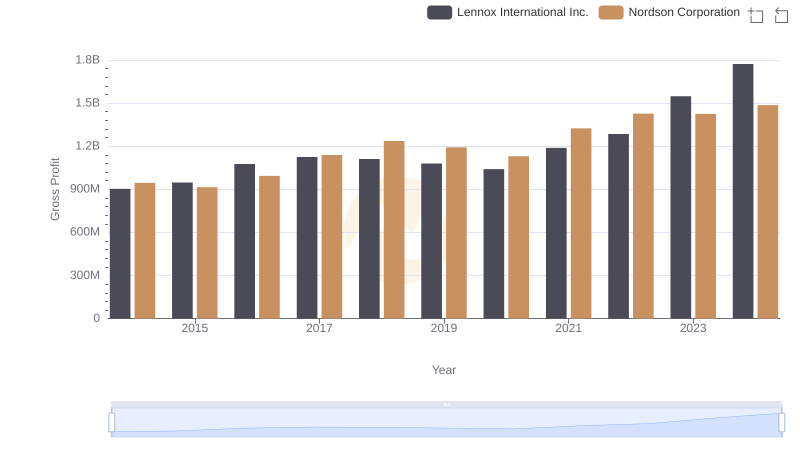
Gross Profit Trends Compared: Lennox International Inc. vs Nordson Corporation
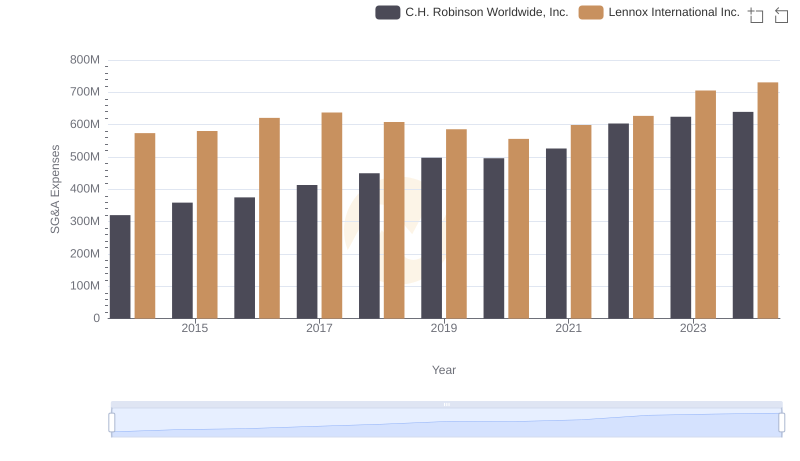
Comparing SG&A Expenses: Lennox International Inc. vs C.H. Robinson Worldwide, Inc. Trends and Insights
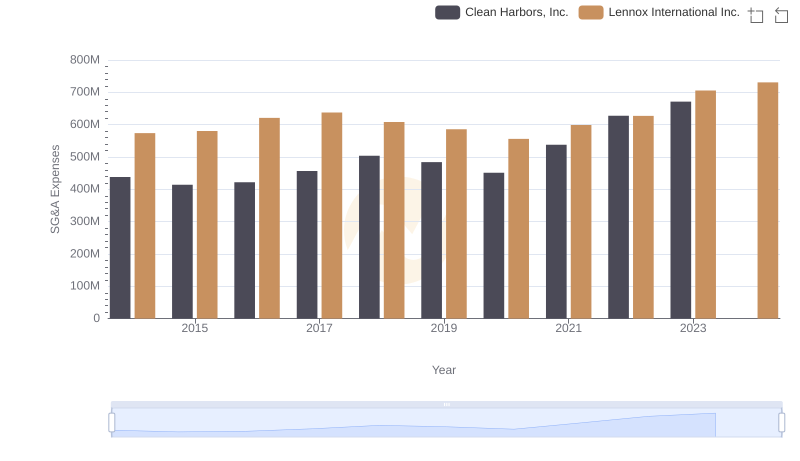
Lennox International Inc. and Clean Harbors, Inc.: SG&A Spending Patterns Compared
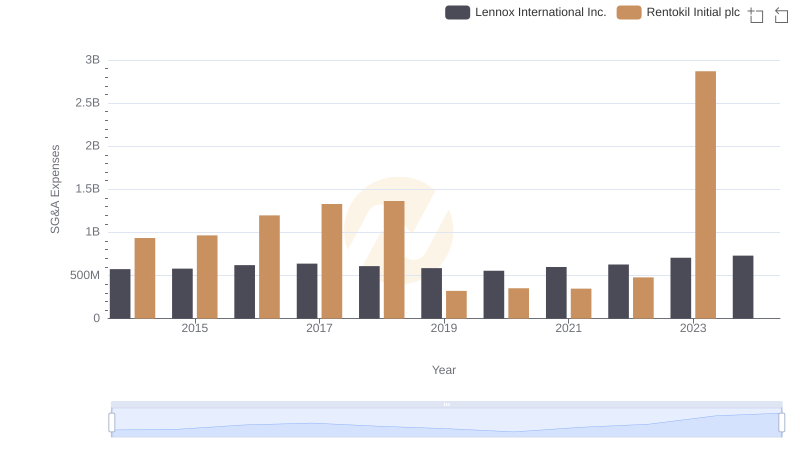
Who Optimizes SG&A Costs Better? Lennox International Inc. or Rentokil Initial plc
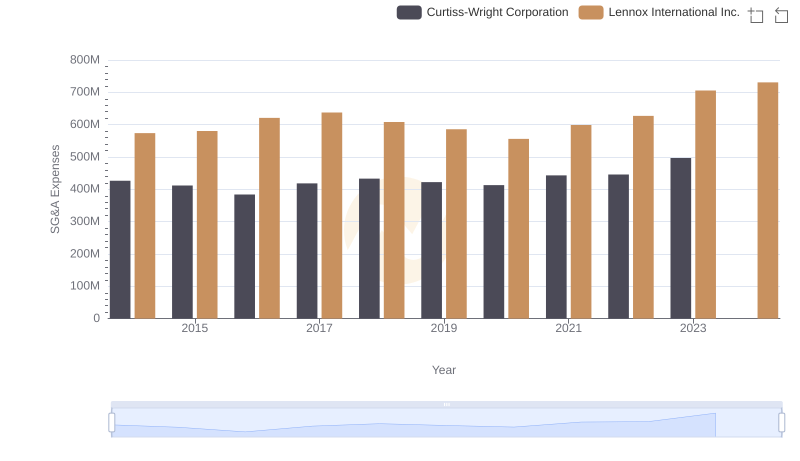
SG&A Efficiency Analysis: Comparing Lennox International Inc. and Curtiss-Wright Corporation
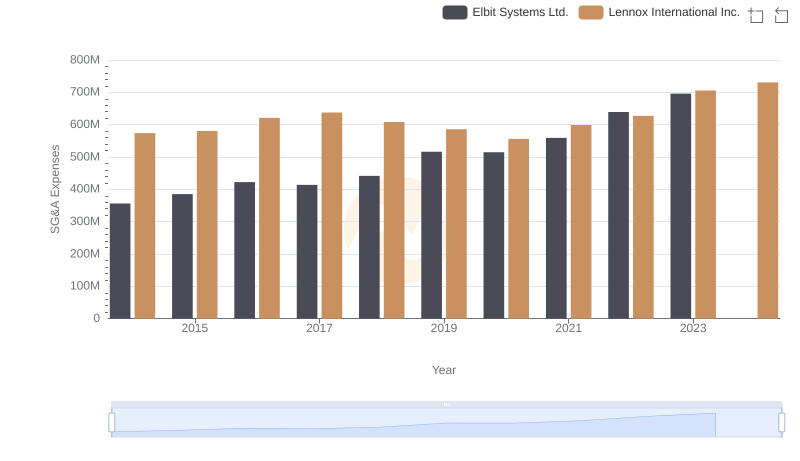
Comparing SG&A Expenses: Lennox International Inc. vs Elbit Systems Ltd. Trends and Insights
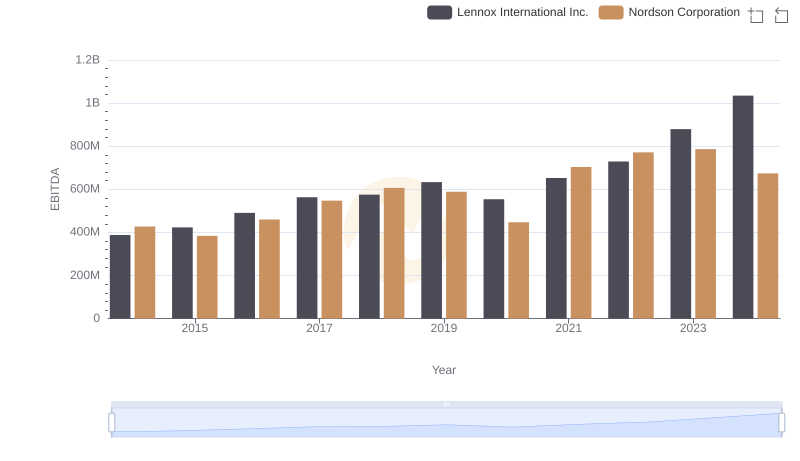
Lennox International Inc. vs Nordson Corporation: In-Depth EBITDA Performance Comparison
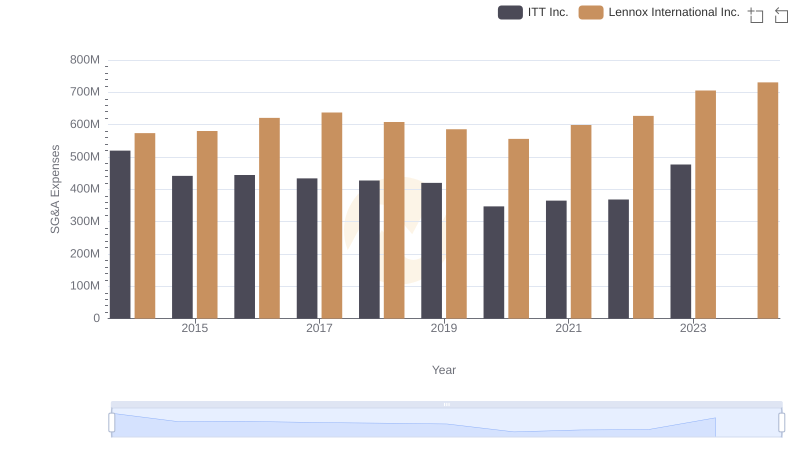
Who Optimizes SG&A Costs Better? Lennox International Inc. or ITT Inc.