| __timestamp | Carlisle Companies Incorporated | EMCOR Group, Inc. |
|---|---|---|
| Wednesday, January 1, 2014 | 379000000 | 626478000 |
| Thursday, January 1, 2015 | 461900000 | 656573000 |
| Friday, January 1, 2016 | 532000000 | 725538000 |
| Sunday, January 1, 2017 | 589400000 | 757062000 |
| Monday, January 1, 2018 | 625400000 | 799157000 |
| Tuesday, January 1, 2019 | 667100000 | 893453000 |
| Wednesday, January 1, 2020 | 603200000 | 903584000 |
| Friday, January 1, 2021 | 698200000 | 970937000 |
| Saturday, January 1, 2022 | 811500000 | 1038717000 |
| Sunday, January 1, 2023 | 625200000 | 1211233000 |
| Monday, January 1, 2024 | 722800000 |
Unleashing insights
In the competitive landscape of industrial services and manufacturing, understanding the financial dynamics of leading companies is crucial. Over the past decade, EMCOR Group, Inc. and Carlisle Companies Incorporated have showcased distinct trends in their Selling, General, and Administrative (SG&A) expenses. From 2014 to 2023, EMCOR consistently outpaced Carlisle, with SG&A expenses peaking at approximately 1.21 billion in 2023, marking a 93% increase from 2014. In contrast, Carlisle's expenses grew by 65% over the same period, reaching their highest in 2022. This divergence highlights EMCOR's aggressive expansion and operational strategies compared to Carlisle's more conservative approach. Such insights are invaluable for investors and analysts seeking to understand the financial health and strategic priorities of these industry giants.
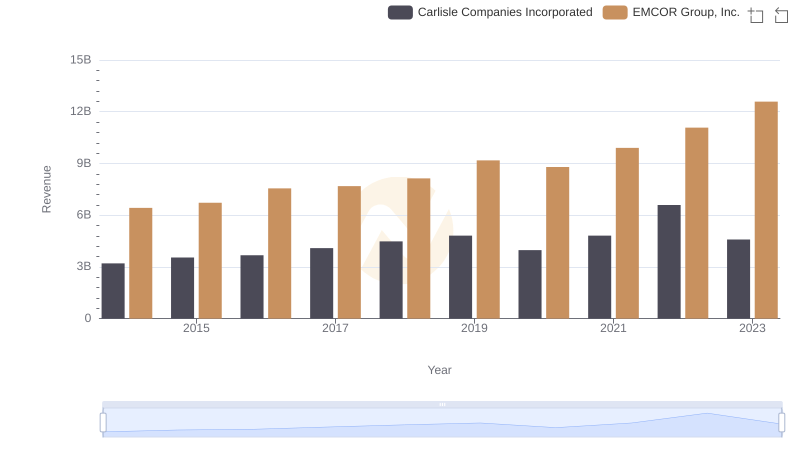
EMCOR Group, Inc. or Carlisle Companies Incorporated: Who Leads in Yearly Revenue?
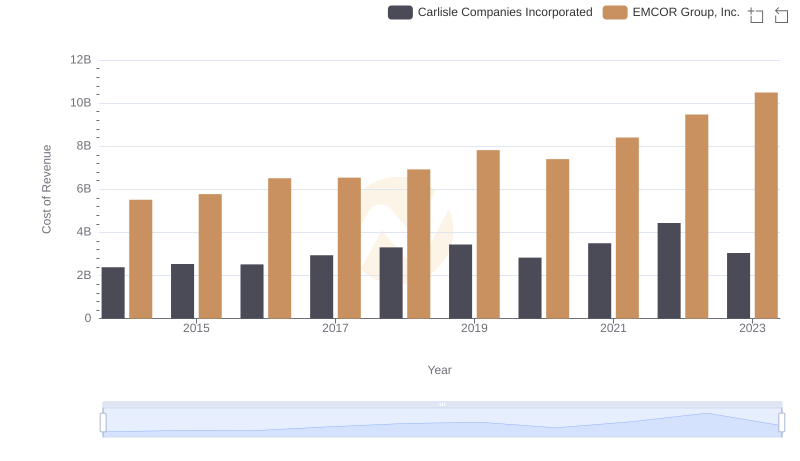
Comparing Cost of Revenue Efficiency: EMCOR Group, Inc. vs Carlisle Companies Incorporated
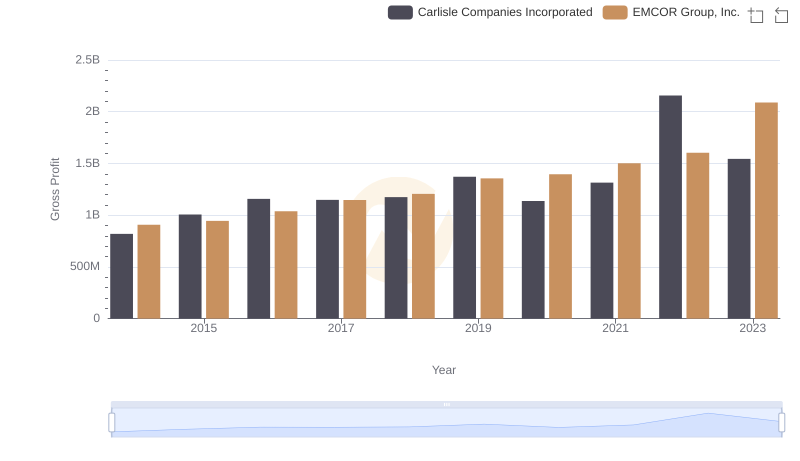
Gross Profit Trends Compared: EMCOR Group, Inc. vs Carlisle Companies Incorporated

Breaking Down SG&A Expenses: EMCOR Group, Inc. vs J.B. Hunt Transport Services, Inc.
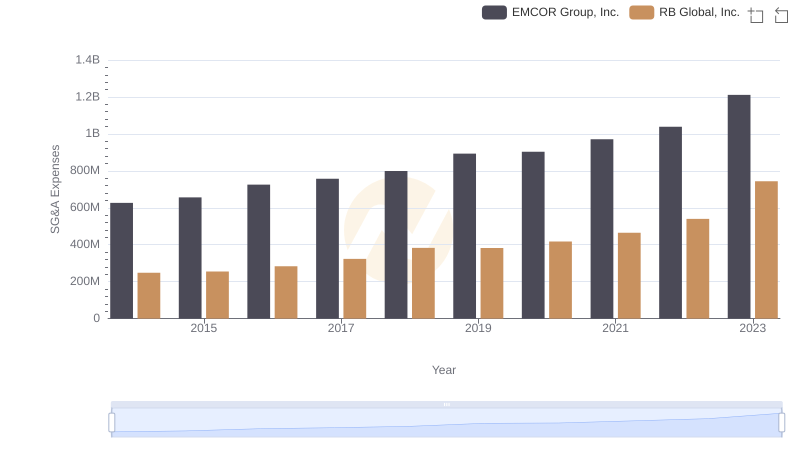
EMCOR Group, Inc. and RB Global, Inc.: SG&A Spending Patterns Compared
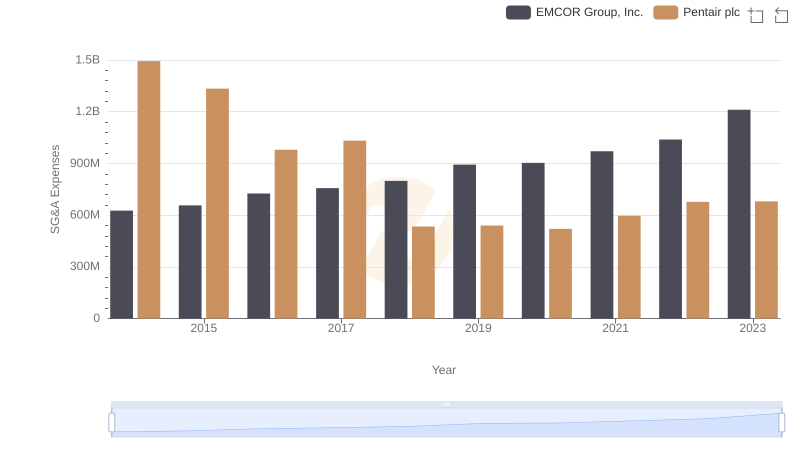
EMCOR Group, Inc. and Pentair plc: SG&A Spending Patterns Compared
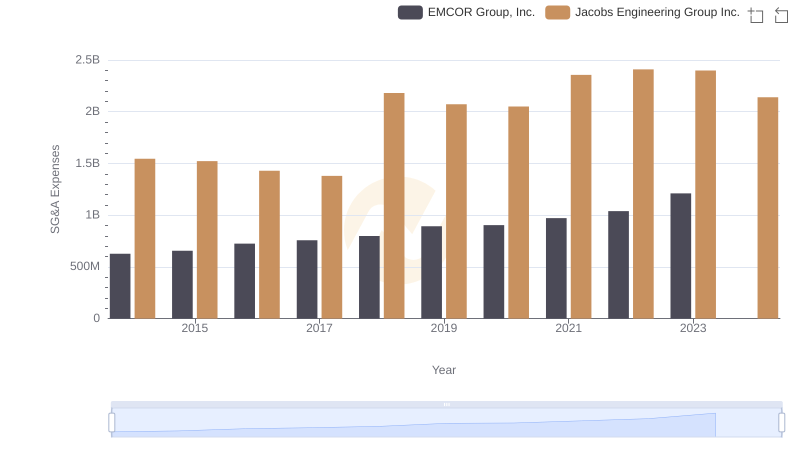
Selling, General, and Administrative Costs: EMCOR Group, Inc. vs Jacobs Engineering Group Inc.
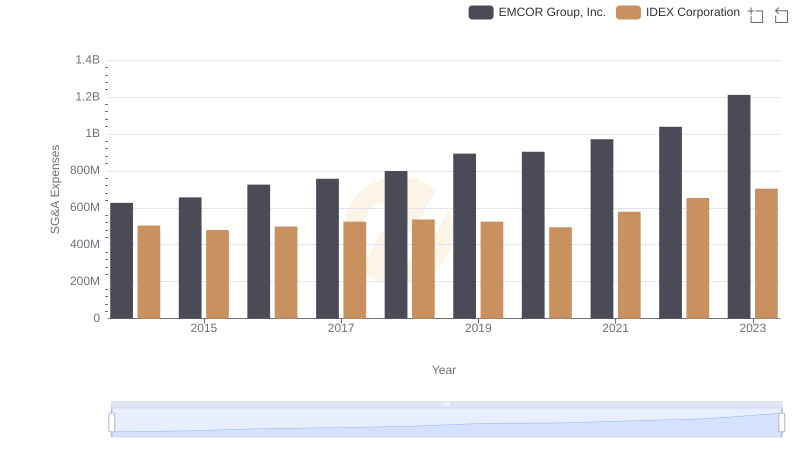
Breaking Down SG&A Expenses: EMCOR Group, Inc. vs IDEX Corporation
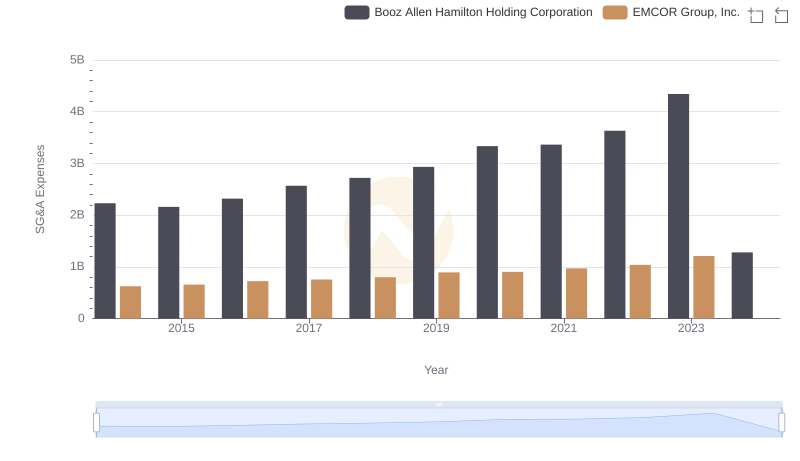
EMCOR Group, Inc. vs Booz Allen Hamilton Holding Corporation: SG&A Expense Trends
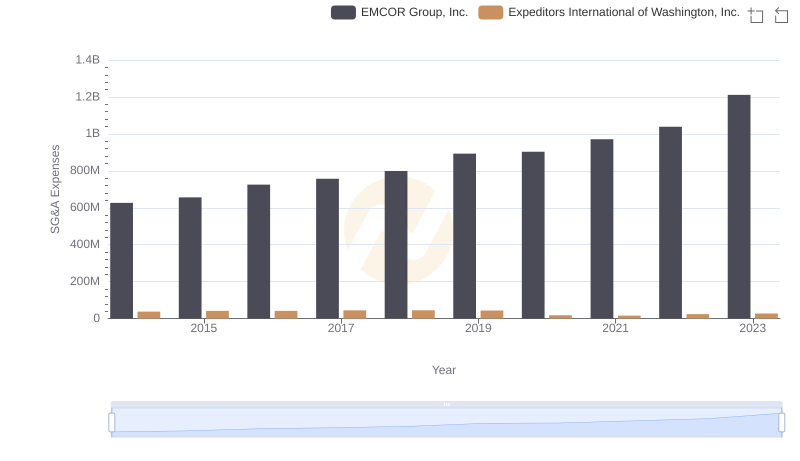
EMCOR Group, Inc. and Expeditors International of Washington, Inc.: SG&A Spending Patterns Compared
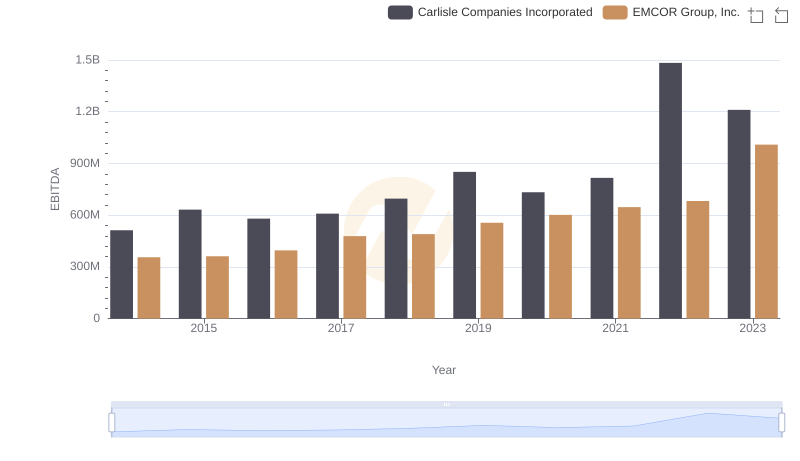
EMCOR Group, Inc. and Carlisle Companies Incorporated: A Detailed Examination of EBITDA Performance