| __timestamp | Cintas Corporation | L3Harris Technologies, Inc. |
|---|---|---|
| Wednesday, January 1, 2014 | 4551812000 | 3885000000 |
| Thursday, January 1, 2015 | 4476886000 | 5992000000 |
| Friday, January 1, 2016 | 4905458000 | 5897000000 |
| Sunday, January 1, 2017 | 5323381000 | 6168000000 |
| Monday, January 1, 2018 | 6476632000 | 6801000000 |
| Tuesday, January 1, 2019 | 6892303000 | 18526000000 |
| Wednesday, January 1, 2020 | 7085120000 | 18194000000 |
| Friday, January 1, 2021 | 7116340000 | 17814000000 |
| Saturday, January 1, 2022 | 7854459000 | 17062000000 |
| Sunday, January 1, 2023 | 8815769000 | 19419000000 |
| Monday, January 1, 2024 | 9596615000 | 21325000000 |
Data in motion
In the ever-evolving landscape of American industry, Cintas Corporation and L3Harris Technologies, Inc. stand as titans in their respective fields. Over the past decade, these companies have demonstrated remarkable growth, with Cintas Corporation increasing its revenue by approximately 111% from 2014 to 2023. Meanwhile, L3Harris Technologies has seen its revenue soar by nearly 400% during the same period.
Cintas Corporation, a leader in corporate identity uniforms, has consistently expanded its market share, with revenues peaking at $9.6 billion in 2023. On the other hand, L3Harris Technologies, a key player in defense and aerospace, reached a staggering $19.4 billion in 2023, despite missing data for 2024. This growth underscores the resilience and adaptability of these companies in a competitive market.
Explore the chart to delve deeper into the financial journeys of these industry leaders.
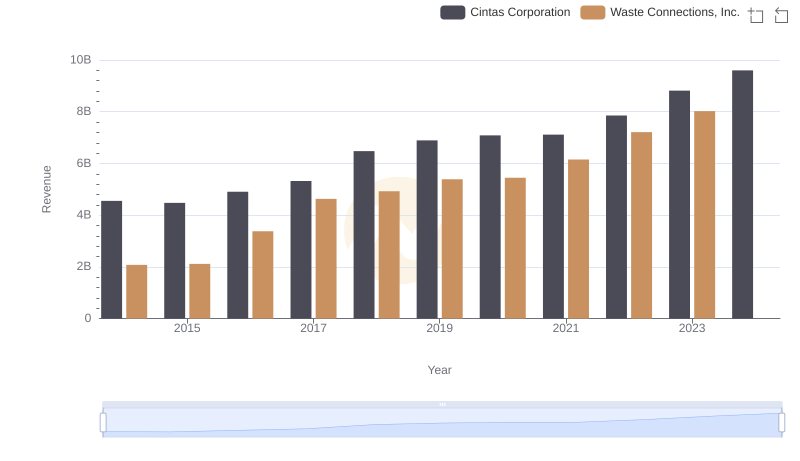
Cintas Corporation and Waste Connections, Inc.: A Comprehensive Revenue Analysis
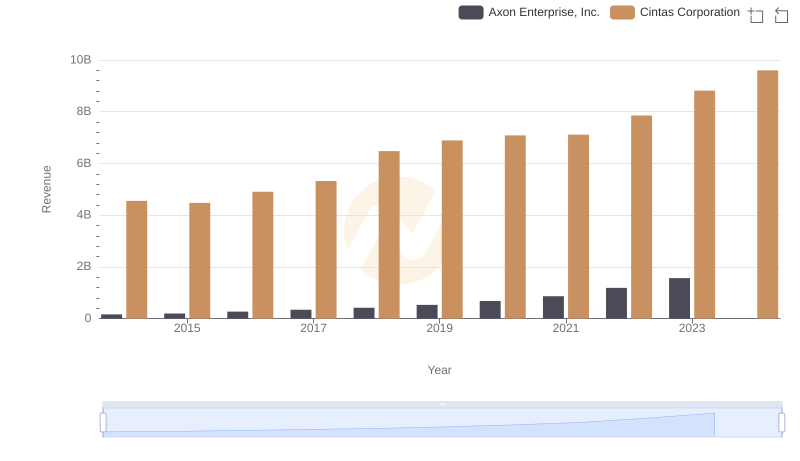
Cintas Corporation vs Axon Enterprise, Inc.: Annual Revenue Growth Compared
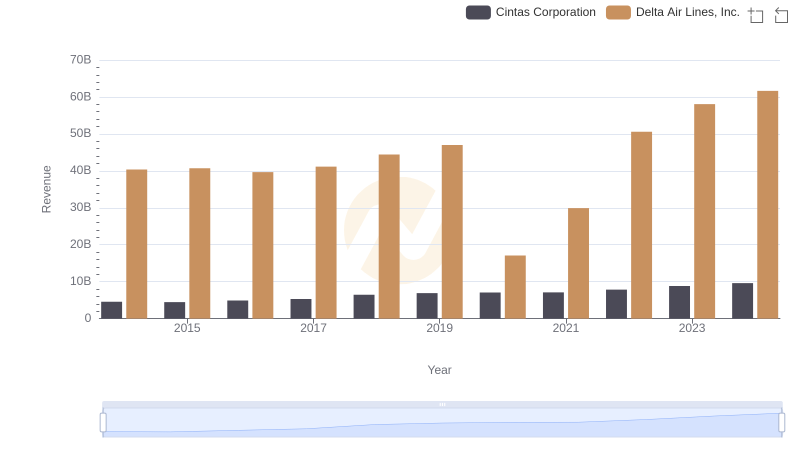
Who Generates More Revenue? Cintas Corporation or Delta Air Lines, Inc.
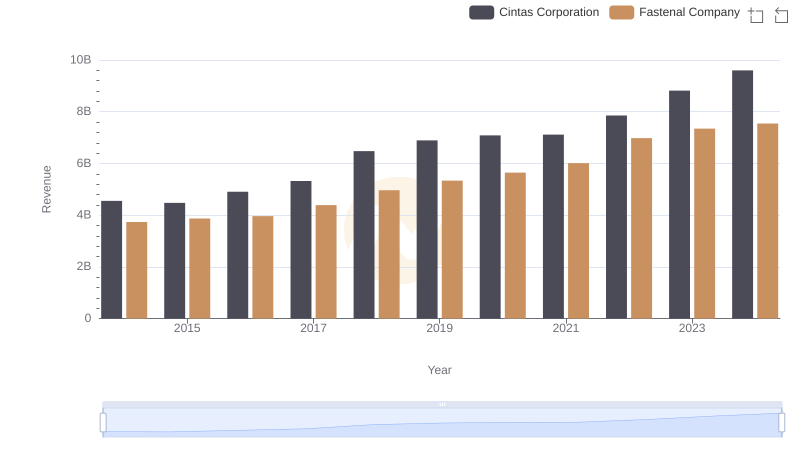
Cintas Corporation vs Fastenal Company: Examining Key Revenue Metrics
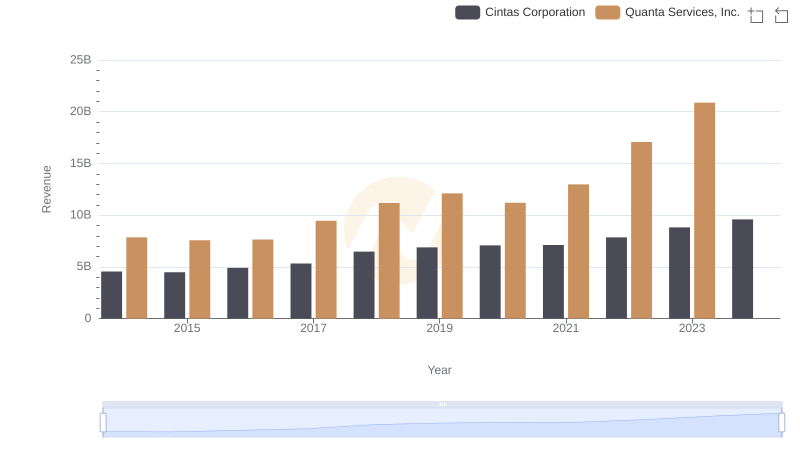
Who Generates More Revenue? Cintas Corporation or Quanta Services, Inc.
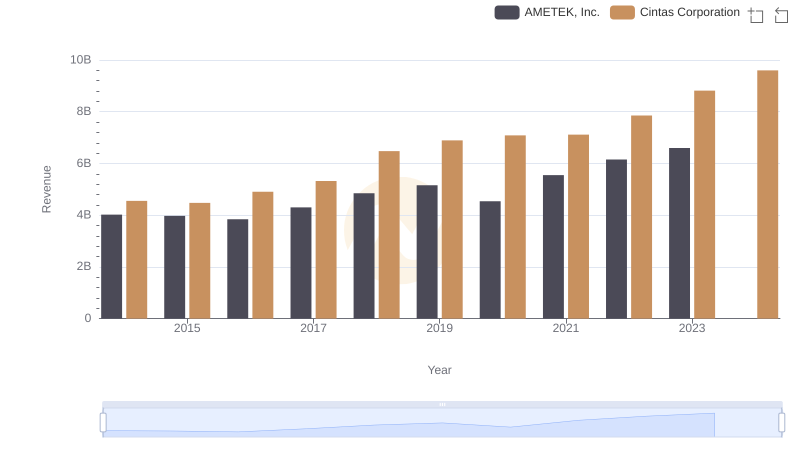
Cintas Corporation vs AMETEK, Inc.: Examining Key Revenue Metrics
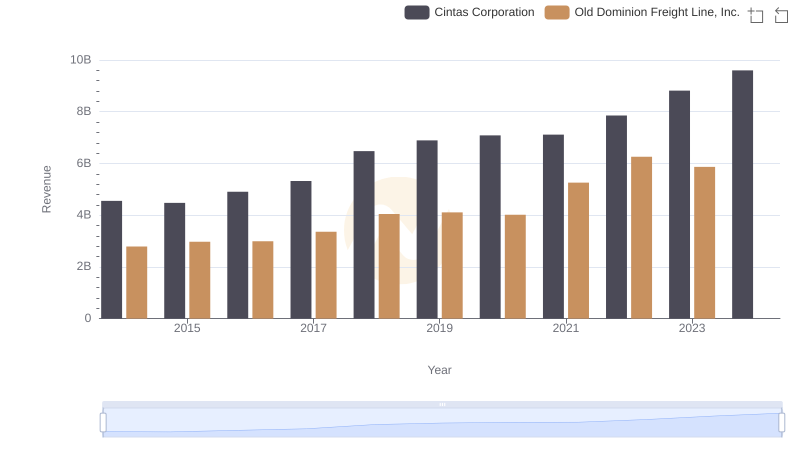
Revenue Insights: Cintas Corporation and Old Dominion Freight Line, Inc. Performance Compared
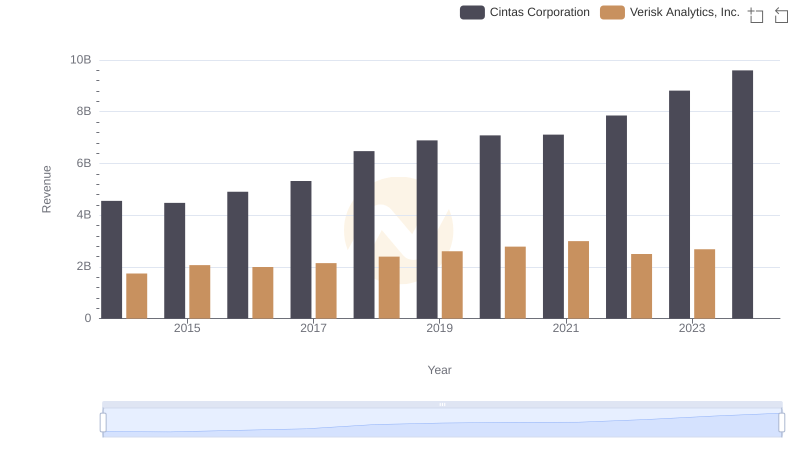
Comparing Revenue Performance: Cintas Corporation or Verisk Analytics, Inc.?
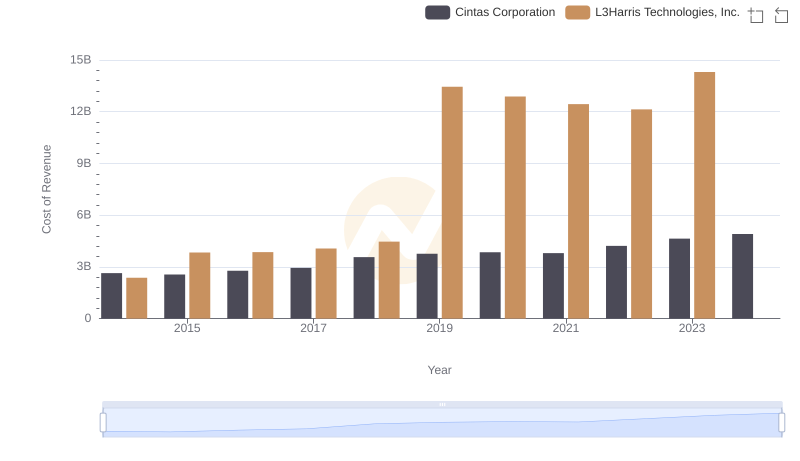
Analyzing Cost of Revenue: Cintas Corporation and L3Harris Technologies, Inc.
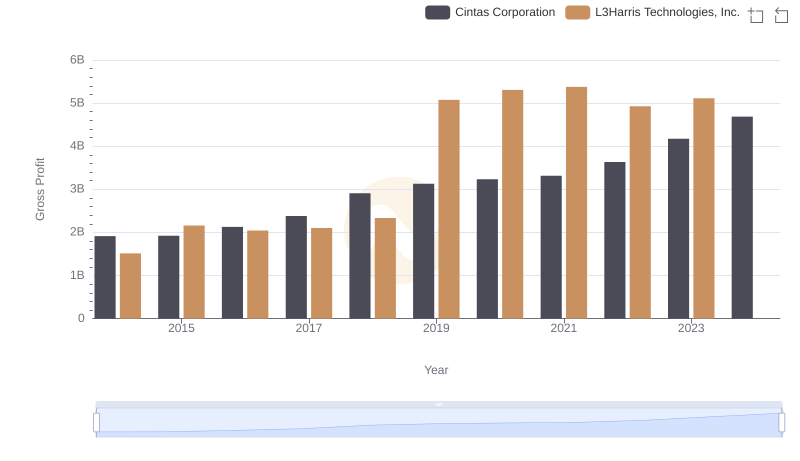
Gross Profit Trends Compared: Cintas Corporation vs L3Harris Technologies, Inc.
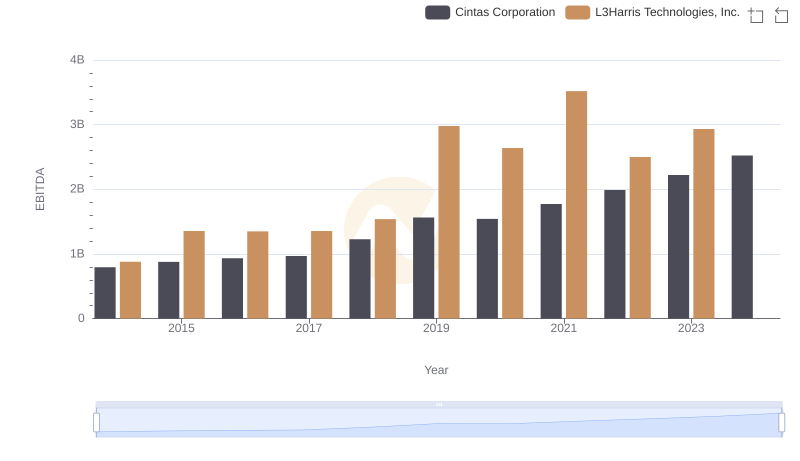
Comprehensive EBITDA Comparison: Cintas Corporation vs L3Harris Technologies, Inc.