| __timestamp | Cintas Corporation | L3Harris Technologies, Inc. |
|---|---|---|
| Wednesday, January 1, 2014 | 2637426000 | 2370000000 |
| Thursday, January 1, 2015 | 2555549000 | 3832000000 |
| Friday, January 1, 2016 | 2775588000 | 3854000000 |
| Sunday, January 1, 2017 | 2943086000 | 4066000000 |
| Monday, January 1, 2018 | 3568109000 | 4467000000 |
| Tuesday, January 1, 2019 | 3763715000 | 13452000000 |
| Wednesday, January 1, 2020 | 3851372000 | 12886000000 |
| Friday, January 1, 2021 | 3801689000 | 12438000000 |
| Saturday, January 1, 2022 | 4222213000 | 12135000000 |
| Sunday, January 1, 2023 | 4642401000 | 14306000000 |
| Monday, January 1, 2024 | 4910199000 | 15801000000 |
Unlocking the unknown
In the ever-evolving landscape of corporate finance, understanding the cost of revenue is crucial for evaluating a company's efficiency and profitability. This analysis delves into the financial journeys of Cintas Corporation and L3Harris Technologies, Inc. over the past decade. From 2014 to 2023, Cintas Corporation's cost of revenue has seen a steady increase, growing by approximately 86%, reflecting its expanding operations and market reach. Meanwhile, L3Harris Technologies, Inc. experienced a more dramatic rise, with its cost of revenue surging by over 500% from 2014 to 2023, highlighting its aggressive growth strategy and significant market expansion.
Interestingly, the data for 2024 is incomplete, with L3Harris Technologies, Inc.'s figures missing, leaving room for speculation about its future trajectory. This analysis provides a snapshot of how these industry leaders manage their operational costs, offering valuable insights for investors and analysts alike.
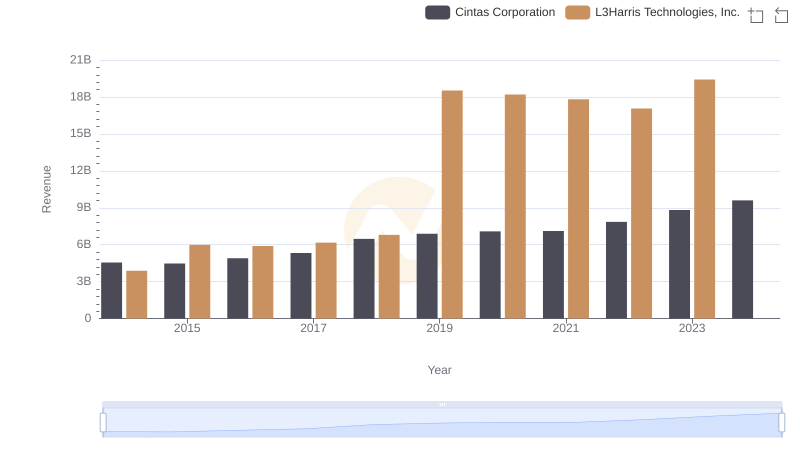
Cintas Corporation and L3Harris Technologies, Inc.: A Comprehensive Revenue Analysis
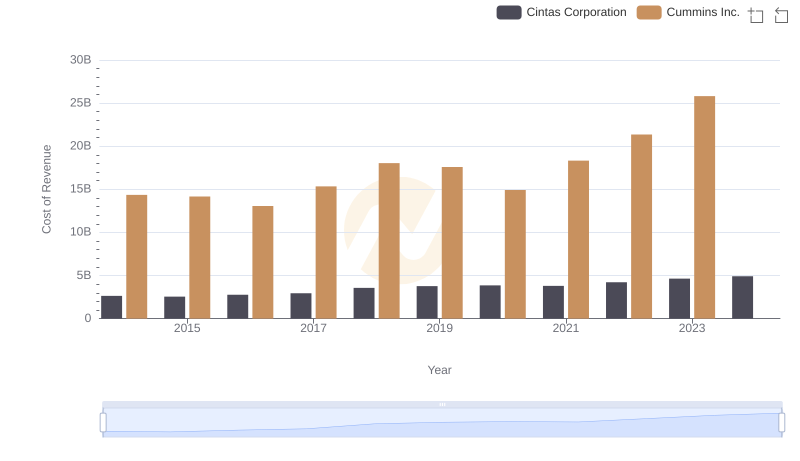
Cost Insights: Breaking Down Cintas Corporation and Cummins Inc.'s Expenses
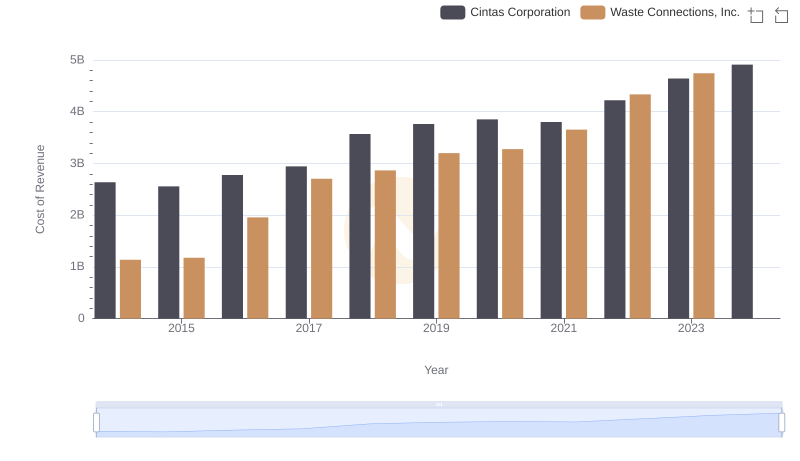
Cost of Revenue Comparison: Cintas Corporation vs Waste Connections, Inc.
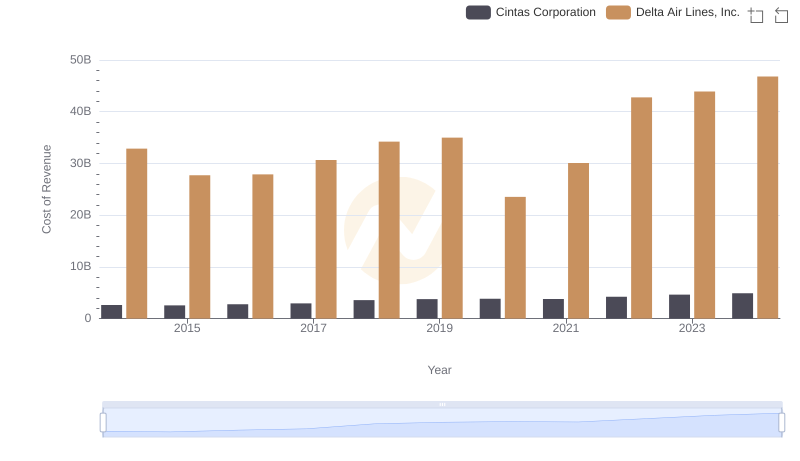
Cost Insights: Breaking Down Cintas Corporation and Delta Air Lines, Inc.'s Expenses
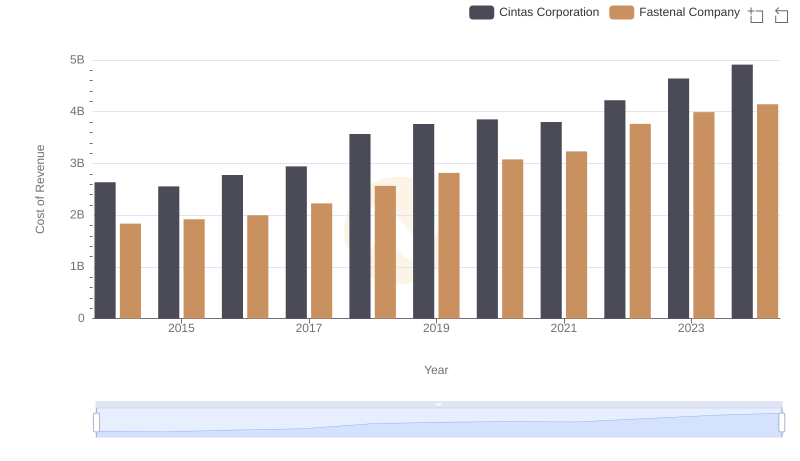
Cost of Revenue Trends: Cintas Corporation vs Fastenal Company
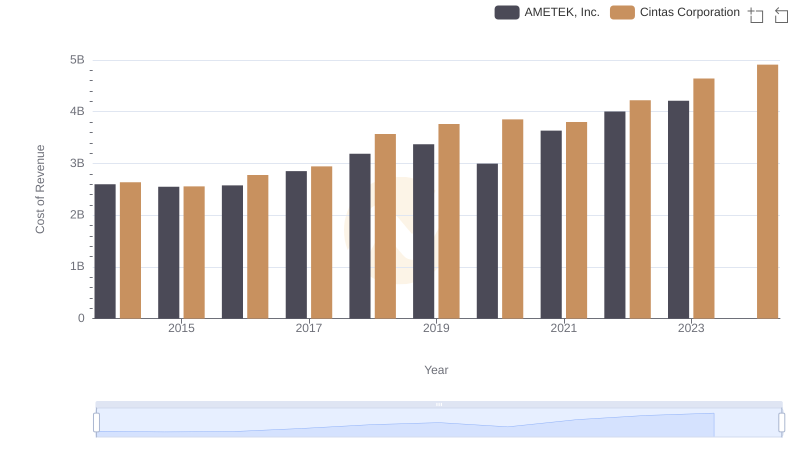
Analyzing Cost of Revenue: Cintas Corporation and AMETEK, Inc.
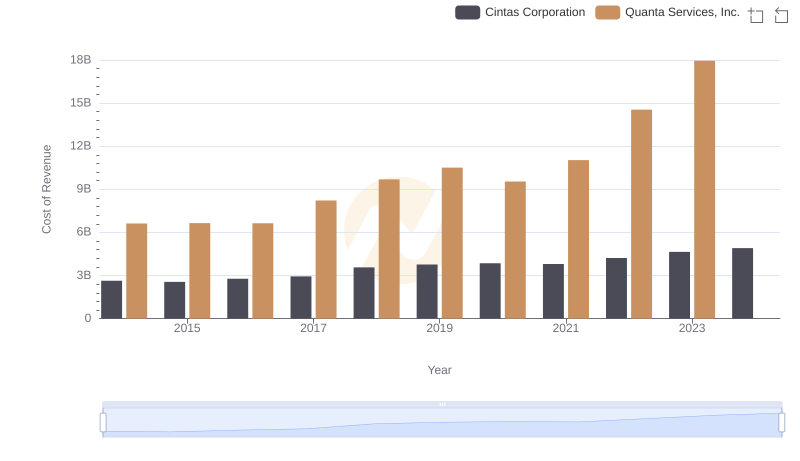
Analyzing Cost of Revenue: Cintas Corporation and Quanta Services, Inc.
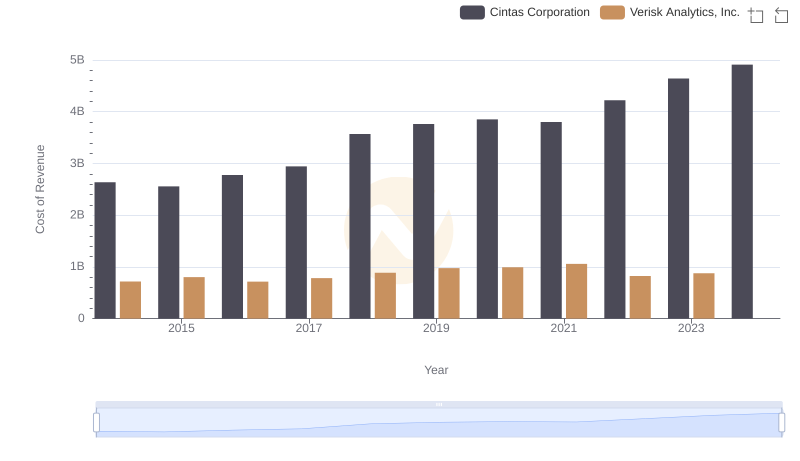
Cost Insights: Breaking Down Cintas Corporation and Verisk Analytics, Inc.'s Expenses
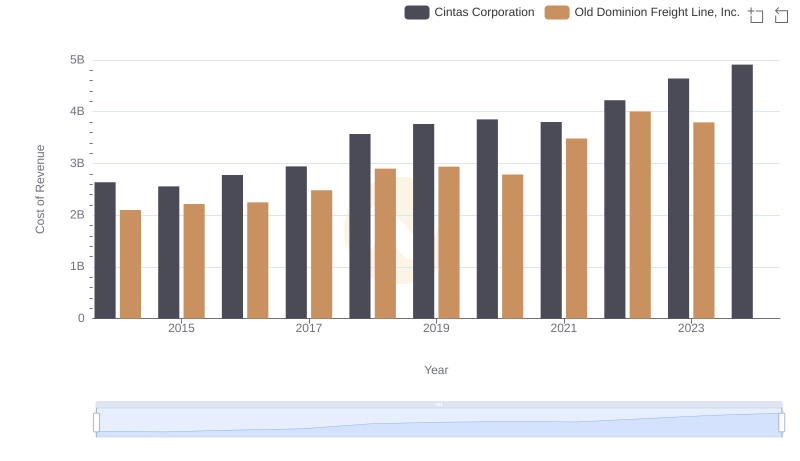
Cost Insights: Breaking Down Cintas Corporation and Old Dominion Freight Line, Inc.'s Expenses
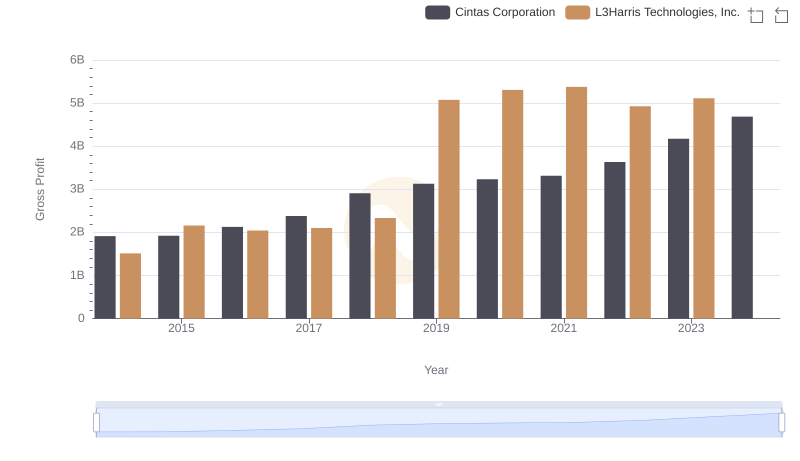
Gross Profit Trends Compared: Cintas Corporation vs L3Harris Technologies, Inc.
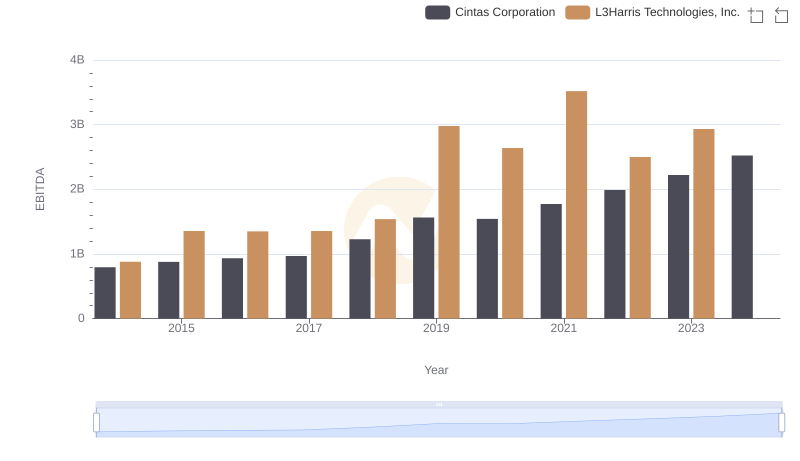
Comprehensive EBITDA Comparison: Cintas Corporation vs L3Harris Technologies, Inc.