| __timestamp | AMETEK, Inc. | HEICO Corporation |
|---|---|---|
| Wednesday, January 1, 2014 | 1424947000 | 398312000 |
| Thursday, January 1, 2015 | 1425015000 | 434179000 |
| Friday, January 1, 2016 | 1264867000 | 515492000 |
| Sunday, January 1, 2017 | 1448739000 | 574725000 |
| Monday, January 1, 2018 | 1659562000 | 690715000 |
| Tuesday, January 1, 2019 | 1787660000 | 813840000 |
| Wednesday, January 1, 2020 | 1543514000 | 682127000 |
| Friday, January 1, 2021 | 1912614000 | 727423000 |
| Saturday, January 1, 2022 | 2145269000 | 862759000 |
| Sunday, January 1, 2023 | 2384465001 | 1153488000 |
| Monday, January 1, 2024 | 6941180000 | 1501726000 |
Unleashing insights
In the competitive landscape of industrial manufacturing, AMETEK, Inc. and HEICO Corporation have showcased intriguing trends in their gross profit margins over the past decade. From 2014 to 2023, AMETEK, Inc. has consistently outperformed HEICO Corporation, with a notable 67% increase in gross profit, peaking in 2023. This growth trajectory highlights AMETEK's strategic prowess in navigating market challenges and capitalizing on opportunities.
Conversely, HEICO Corporation, while trailing behind, has demonstrated a steady upward trend, achieving a 190% increase in gross profit from 2014 to 2024. This remarkable growth underscores HEICO's resilience and adaptability in a dynamic market environment. However, the data for AMETEK in 2024 remains elusive, leaving room for speculation on its future performance. As these two industry titans continue to evolve, their financial narratives offer valuable insights into the broader industrial sector.
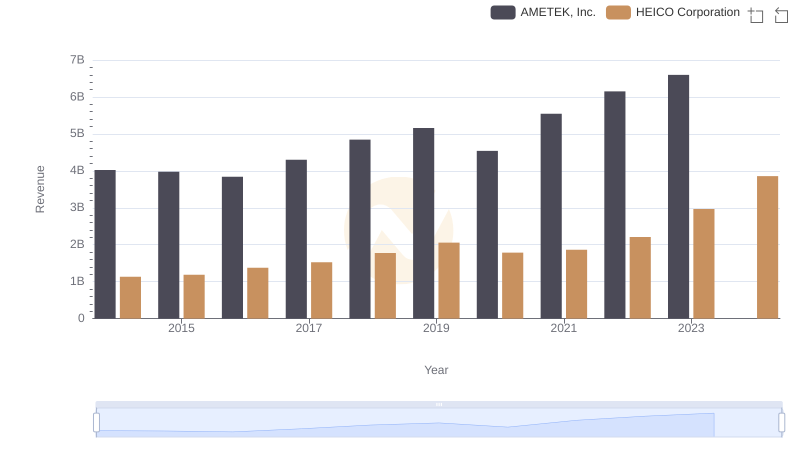
AMETEK, Inc. and HEICO Corporation: A Comprehensive Revenue Analysis
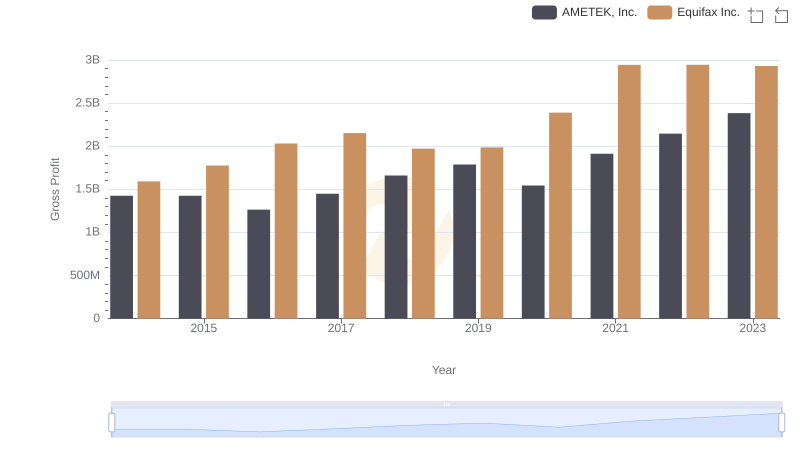
Gross Profit Trends Compared: AMETEK, Inc. vs Equifax Inc.
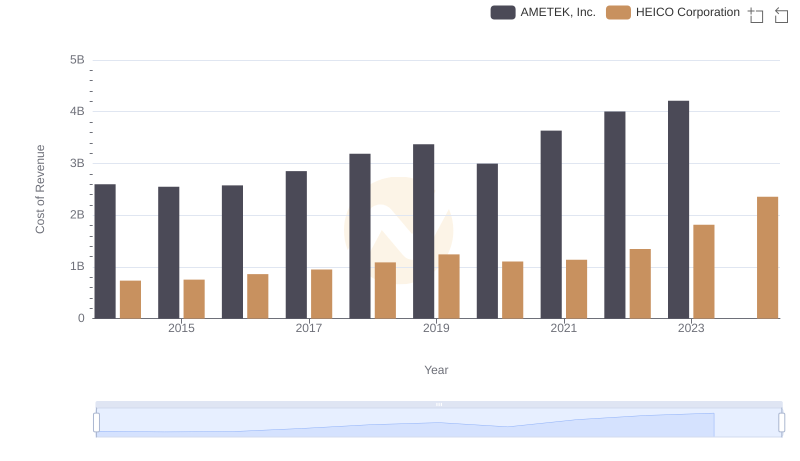
Cost of Revenue Comparison: AMETEK, Inc. vs HEICO Corporation
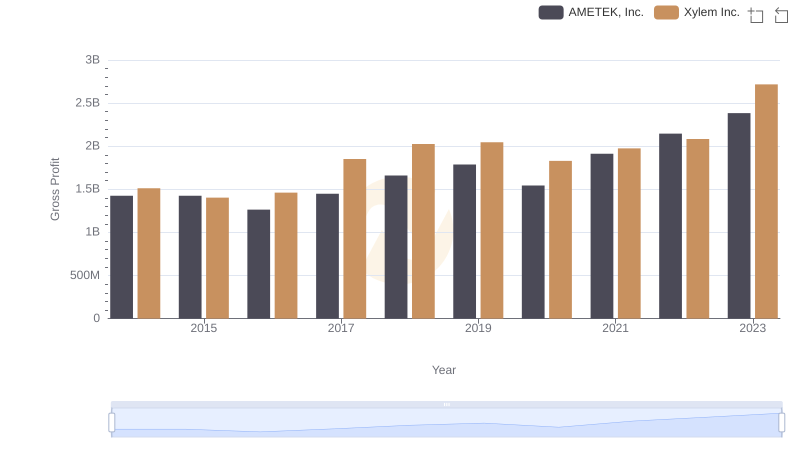
AMETEK, Inc. vs Xylem Inc.: A Gross Profit Performance Breakdown

Key Insights on Gross Profit: AMETEK, Inc. vs Ferrovial SE
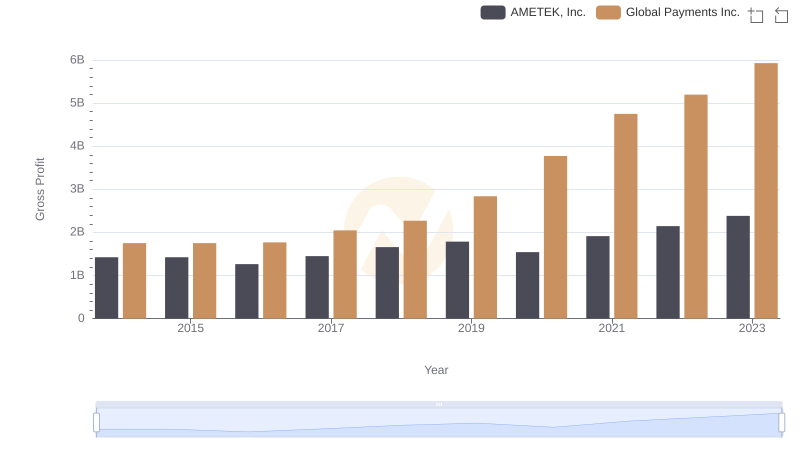
AMETEK, Inc. vs Global Payments Inc.: A Gross Profit Performance Breakdown
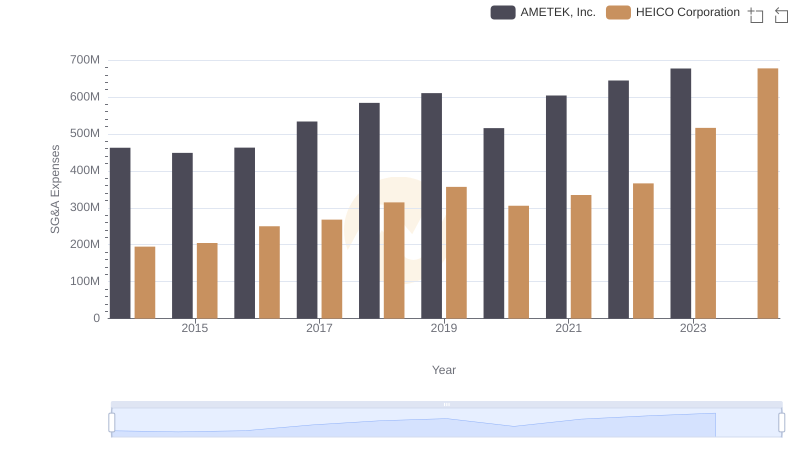
Who Optimizes SG&A Costs Better? AMETEK, Inc. or HEICO Corporation
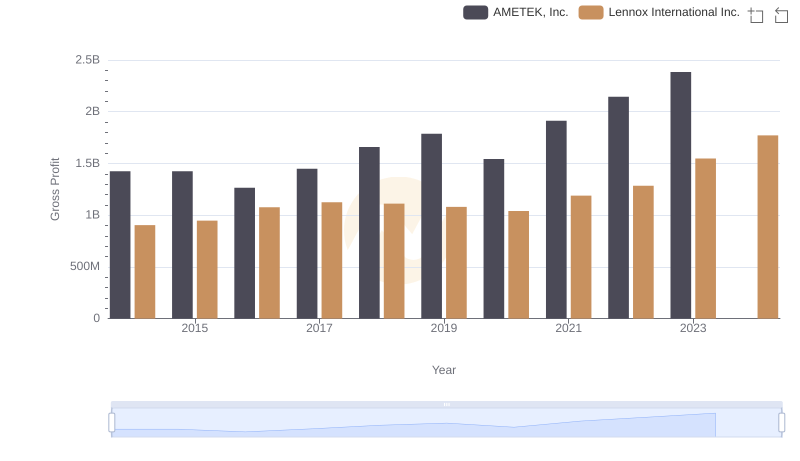
Gross Profit Analysis: Comparing AMETEK, Inc. and Lennox International Inc.
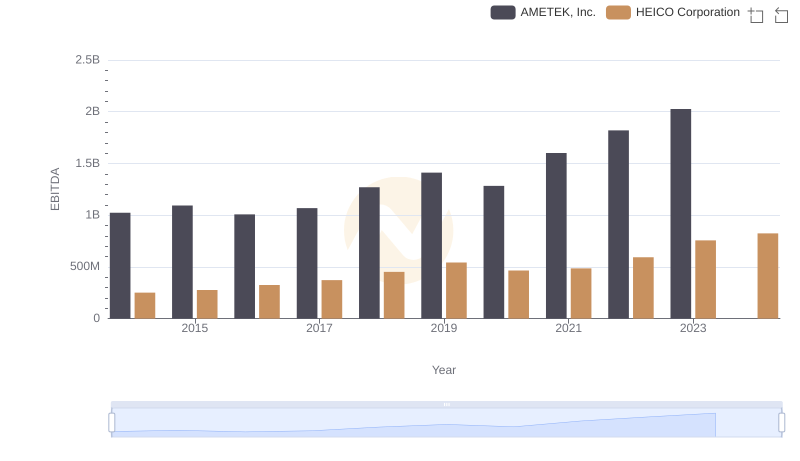
AMETEK, Inc. and HEICO Corporation: A Detailed Examination of EBITDA Performance
Gross Profit Analysis: Comparing AMETEK, Inc. and Hubbell Incorporated