| __timestamp | AMETEK, Inc. | Global Payments Inc. |
|---|---|---|
| Wednesday, January 1, 2014 | 1424947000 | 1751611000 |
| Thursday, January 1, 2015 | 1425015000 | 1750511000 |
| Friday, January 1, 2016 | 1264867000 | 1767444000 |
| Sunday, January 1, 2017 | 1448739000 | 2047126000 |
| Monday, January 1, 2018 | 1659562000 | 2271352000 |
| Tuesday, January 1, 2019 | 1787660000 | 2838089000 |
| Wednesday, January 1, 2020 | 1543514000 | 3772831000 |
| Friday, January 1, 2021 | 1912614000 | 4750037000 |
| Saturday, January 1, 2022 | 2145269000 | 5196898000 |
| Sunday, January 1, 2023 | 2384465001 | 5926898000 |
| Monday, January 1, 2024 | 6941180000 | 6345778000 |
Cracking the code
In the ever-evolving landscape of the financial sector, understanding the performance of key players is crucial. Over the past decade, AMETEK, Inc. and Global Payments Inc. have demonstrated remarkable growth in gross profit, reflecting their strategic prowess and market adaptability.
From 2014 to 2023, Global Payments Inc. has seen its gross profit soar by approximately 238%, starting from a modest $1.75 billion to an impressive $5.93 billion. This growth underscores its robust expansion strategies and successful integration of digital payment solutions. Meanwhile, AMETEK, Inc. has also shown commendable progress, with a 67% increase in gross profit, rising from $1.42 billion to $2.38 billion. This growth trajectory highlights AMETEK's consistent innovation in electronic instruments and electromechanical devices.
As we delve into these financial narratives, it becomes evident that both companies have carved out significant niches, with Global Payments Inc. leading the charge in the digital payment revolution and AMETEK, Inc. excelling in industrial technology.
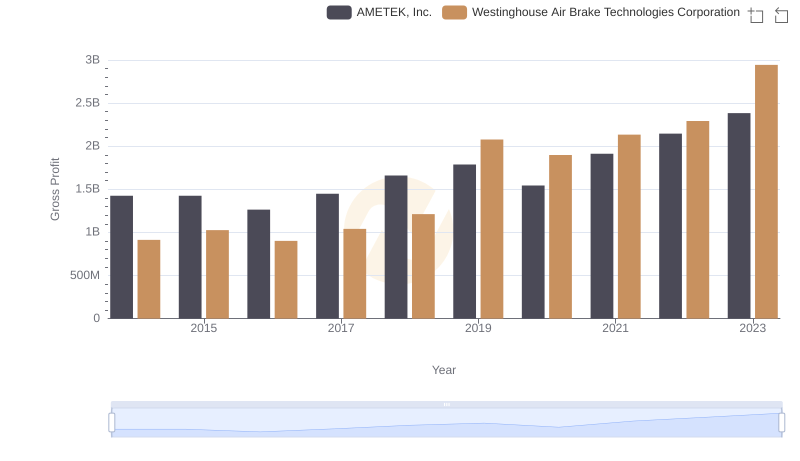
Gross Profit Trends Compared: AMETEK, Inc. vs Westinghouse Air Brake Technologies Corporation
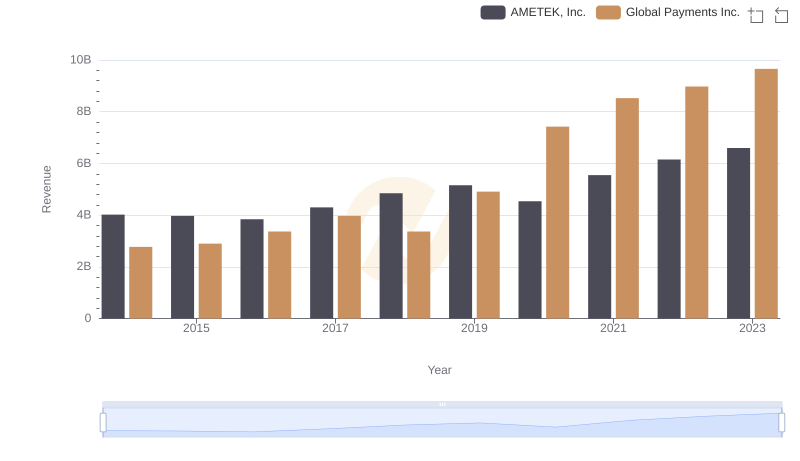
AMETEK, Inc. or Global Payments Inc.: Who Leads in Yearly Revenue?
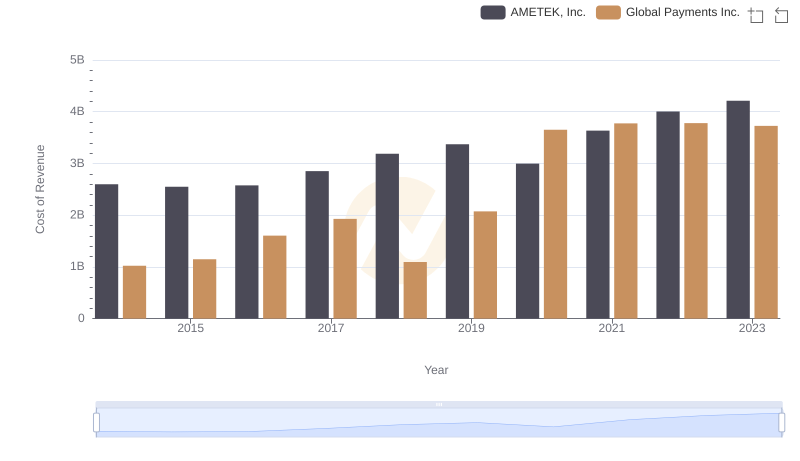
Cost of Revenue Comparison: AMETEK, Inc. vs Global Payments Inc.
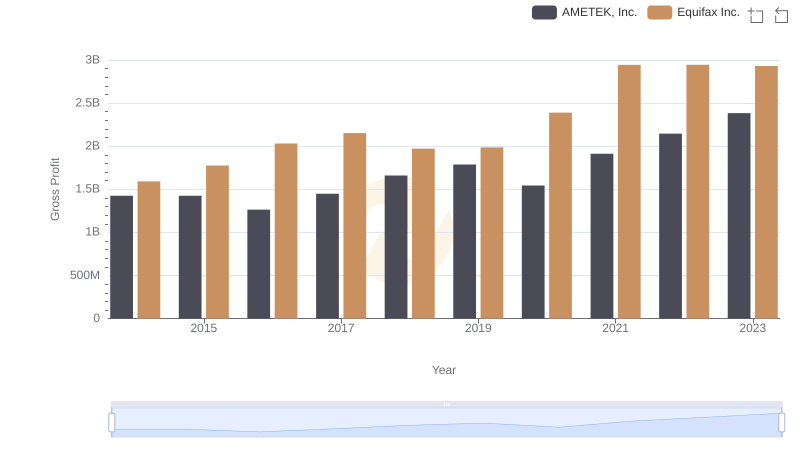
Gross Profit Trends Compared: AMETEK, Inc. vs Equifax Inc.
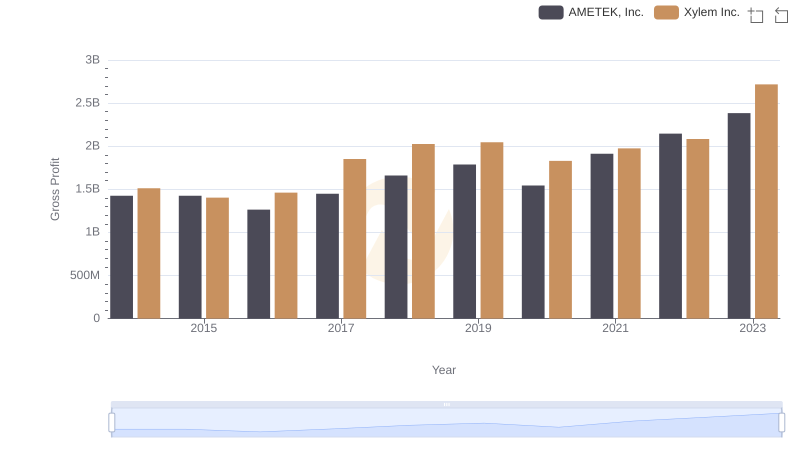
AMETEK, Inc. vs Xylem Inc.: A Gross Profit Performance Breakdown

Key Insights on Gross Profit: AMETEK, Inc. vs Ferrovial SE
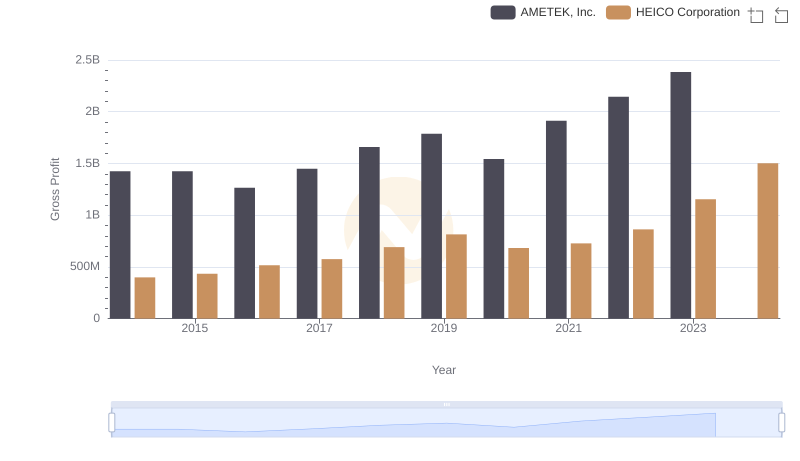
Gross Profit Trends Compared: AMETEK, Inc. vs HEICO Corporation
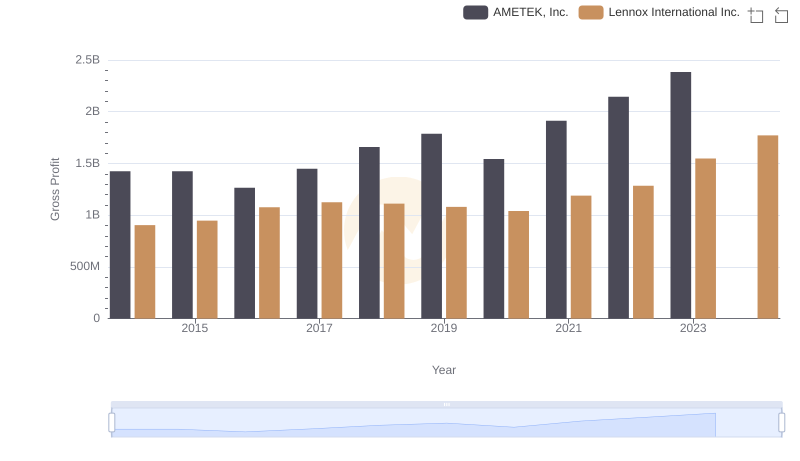
Gross Profit Analysis: Comparing AMETEK, Inc. and Lennox International Inc.
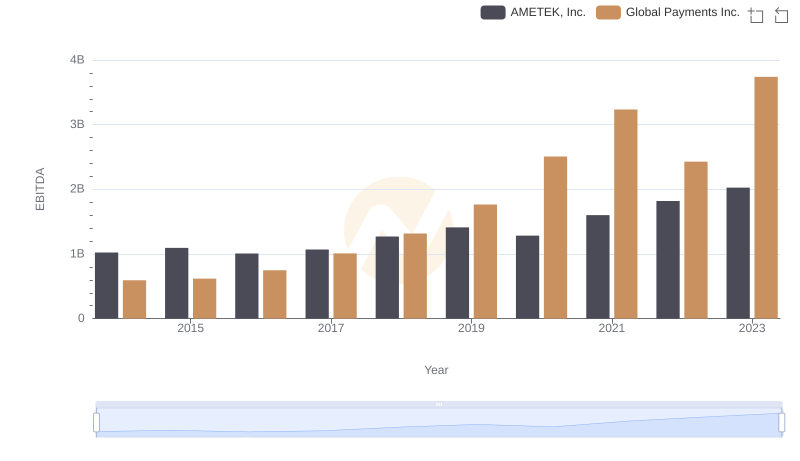
A Side-by-Side Analysis of EBITDA: AMETEK, Inc. and Global Payments Inc.