| __timestamp | AMETEK, Inc. | Lennox International Inc. |
|---|---|---|
| Wednesday, January 1, 2014 | 1424947000 | 903300000 |
| Thursday, January 1, 2015 | 1425015000 | 947400000 |
| Friday, January 1, 2016 | 1264867000 | 1076500000 |
| Sunday, January 1, 2017 | 1448739000 | 1125200000 |
| Monday, January 1, 2018 | 1659562000 | 1111200000 |
| Tuesday, January 1, 2019 | 1787660000 | 1079800000 |
| Wednesday, January 1, 2020 | 1543514000 | 1040100000 |
| Friday, January 1, 2021 | 1912614000 | 1188400000 |
| Saturday, January 1, 2022 | 2145269000 | 1284700000 |
| Sunday, January 1, 2023 | 2384465001 | 1547800000 |
| Monday, January 1, 2024 | 6941180000 | 1771900000 |
Igniting the spark of knowledge
In the competitive landscape of industrial manufacturing, AMETEK, Inc. and Lennox International Inc. have showcased intriguing trends in their gross profit margins over the past decade. From 2014 to 2023, AMETEK, Inc. has consistently outperformed Lennox International Inc., with a notable 67% increase in gross profit, peaking at approximately $2.38 billion in 2023. In contrast, Lennox International Inc. experienced a steady growth of around 71%, reaching about $1.55 billion in the same year.
The data reveals a robust upward trajectory for both companies, with AMETEK, Inc. maintaining a higher gross profit margin throughout the years. However, Lennox International Inc. has shown remarkable resilience, closing the gap significantly by 2023. The absence of data for AMETEK, Inc. in 2024 leaves room for speculation on future trends, while Lennox International Inc. continues its upward climb.
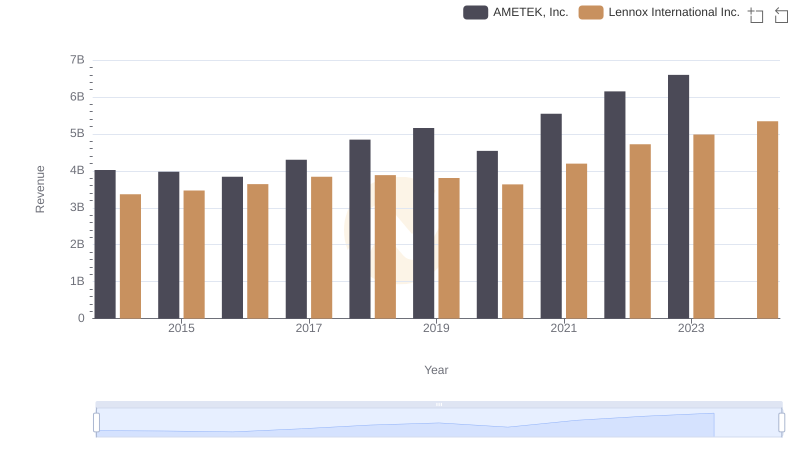
Annual Revenue Comparison: AMETEK, Inc. vs Lennox International Inc.
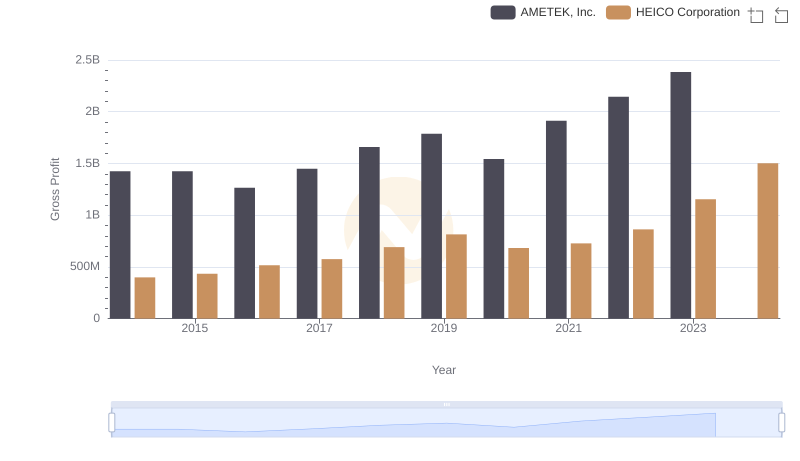
Gross Profit Trends Compared: AMETEK, Inc. vs HEICO Corporation
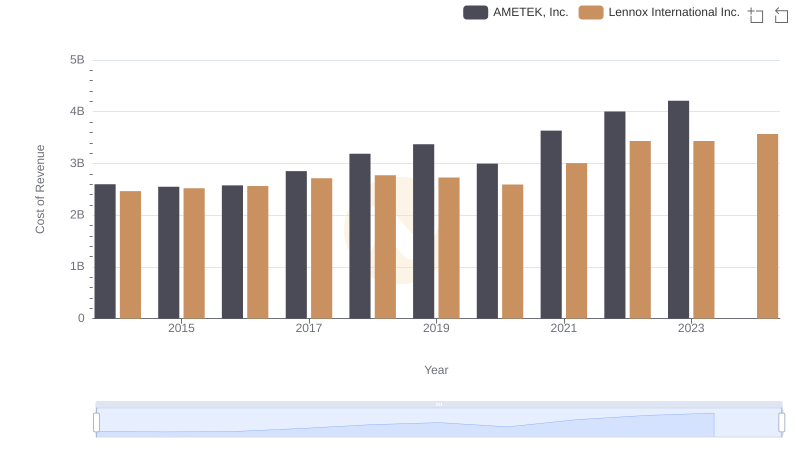
Cost of Revenue Comparison: AMETEK, Inc. vs Lennox International Inc.
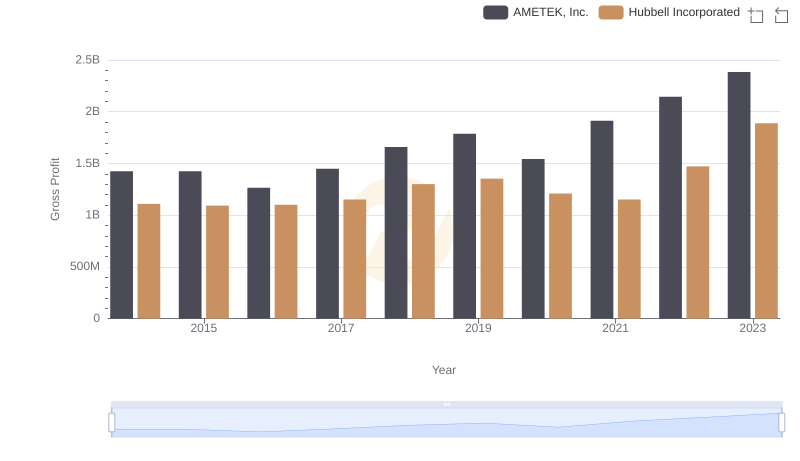
Gross Profit Analysis: Comparing AMETEK, Inc. and Hubbell Incorporated
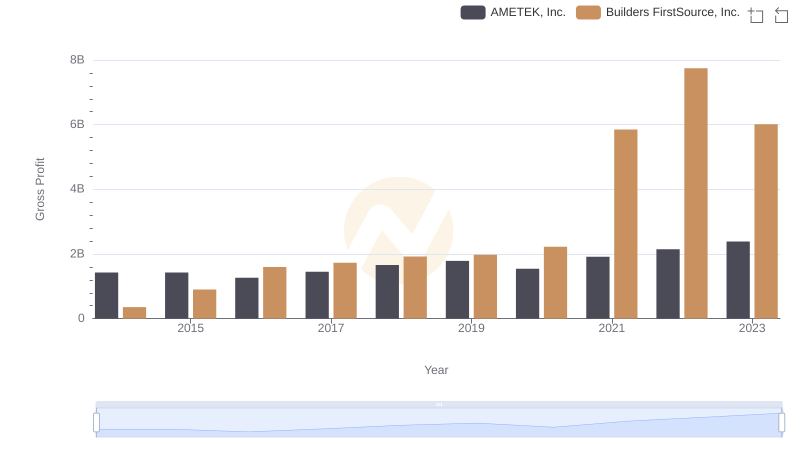
Gross Profit Trends Compared: AMETEK, Inc. vs Builders FirstSource, Inc.

Gross Profit Trends Compared: AMETEK, Inc. vs EMCOR Group, Inc.
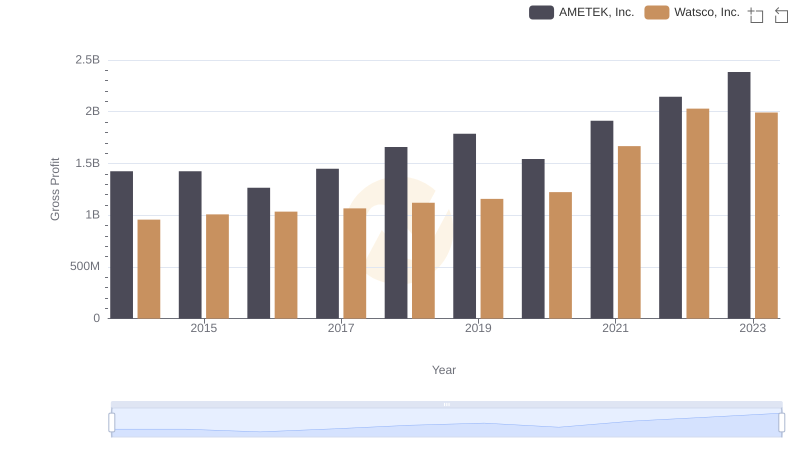
AMETEK, Inc. vs Watsco, Inc.: A Gross Profit Performance Breakdown
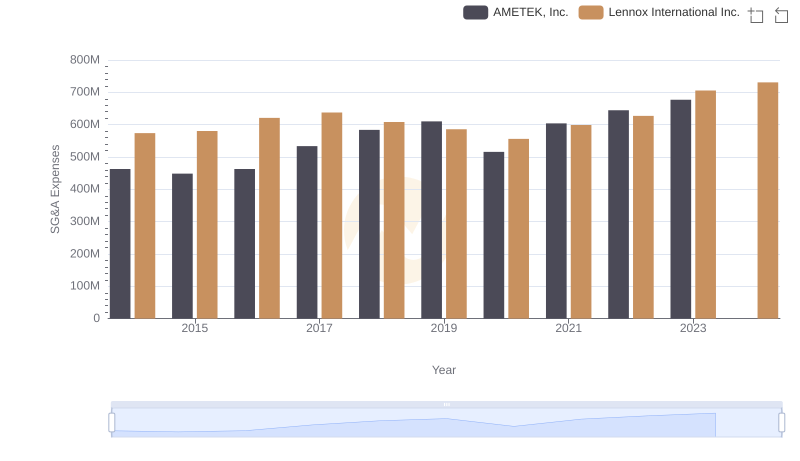
AMETEK, Inc. or Lennox International Inc.: Who Manages SG&A Costs Better?
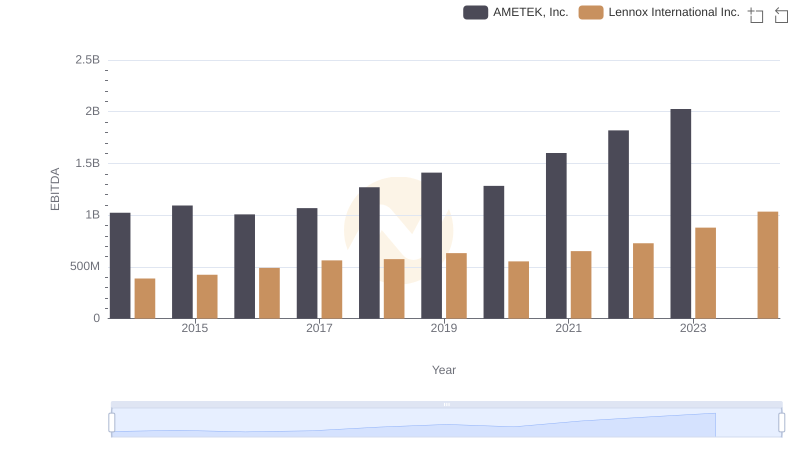
AMETEK, Inc. vs Lennox International Inc.: In-Depth EBITDA Performance Comparison