| __timestamp | AMETEK, Inc. | HEICO Corporation |
|---|---|---|
| Wednesday, January 1, 2014 | 1023344000 | 251213000 |
| Thursday, January 1, 2015 | 1093776000 | 276790000 |
| Friday, January 1, 2016 | 1007213000 | 325022000 |
| Sunday, January 1, 2017 | 1068174000 | 372581000 |
| Monday, January 1, 2018 | 1269415000 | 452287000 |
| Tuesday, January 1, 2019 | 1411422000 | 542136000 |
| Wednesday, January 1, 2020 | 1283159000 | 465714000 |
| Friday, January 1, 2021 | 1600782000 | 486243000 |
| Saturday, January 1, 2022 | 1820119000 | 592709000 |
| Sunday, January 1, 2023 | 2025843000 | 756767000 |
| Monday, January 1, 2024 | 1779562000 | 824455000 |
Unlocking the unknown
In the ever-evolving landscape of industrial technology, AMETEK, Inc. and HEICO Corporation have emerged as formidable players. Over the past decade, from 2014 to 2023, AMETEK's EBITDA has shown a remarkable growth trajectory, increasing by nearly 98%, from approximately $1 billion to over $2 billion. This growth underscores AMETEK's strategic prowess in expanding its market footprint and optimizing operational efficiencies.
Conversely, HEICO Corporation, while starting from a smaller base, has demonstrated a robust growth rate of over 200%, with its EBITDA rising from around $250 million to over $750 million. This impressive surge highlights HEICO's innovative approach and adaptability in the aerospace and electronics sectors.
The data for 2024 is incomplete, indicating potential future developments. As these companies continue to innovate, their financial performance will be a key indicator of their industry leadership.
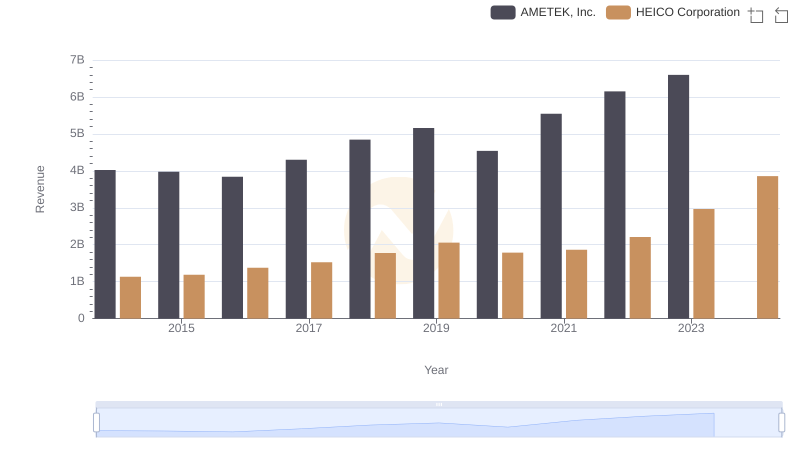
AMETEK, Inc. and HEICO Corporation: A Comprehensive Revenue Analysis
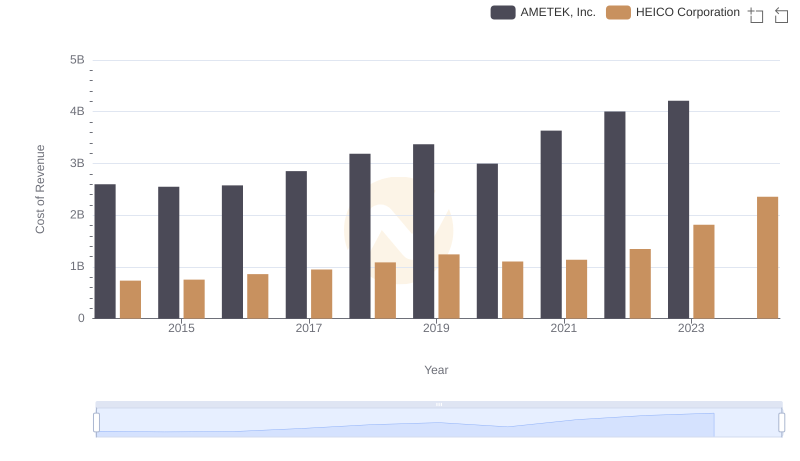
Cost of Revenue Comparison: AMETEK, Inc. vs HEICO Corporation
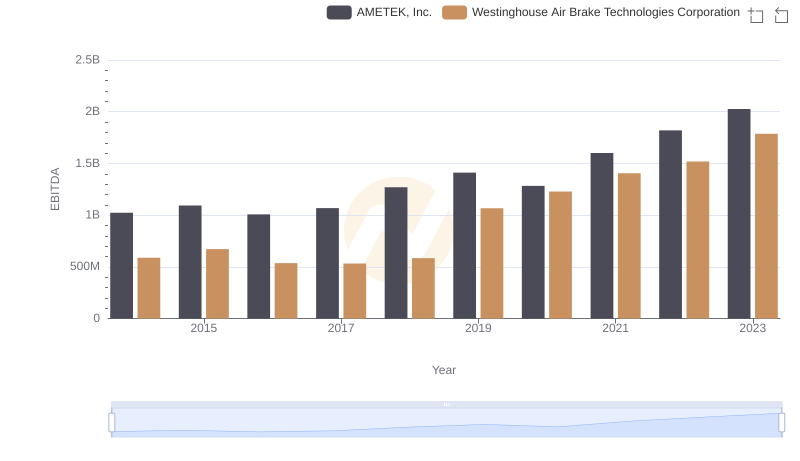
A Professional Review of EBITDA: AMETEK, Inc. Compared to Westinghouse Air Brake Technologies Corporation
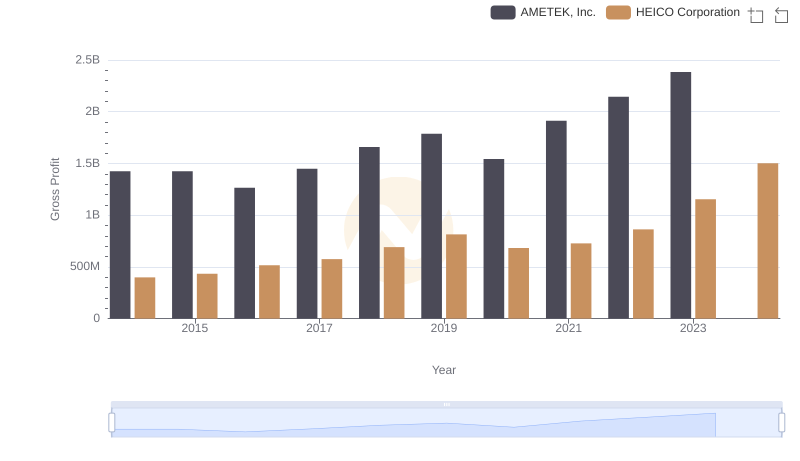
Gross Profit Trends Compared: AMETEK, Inc. vs HEICO Corporation
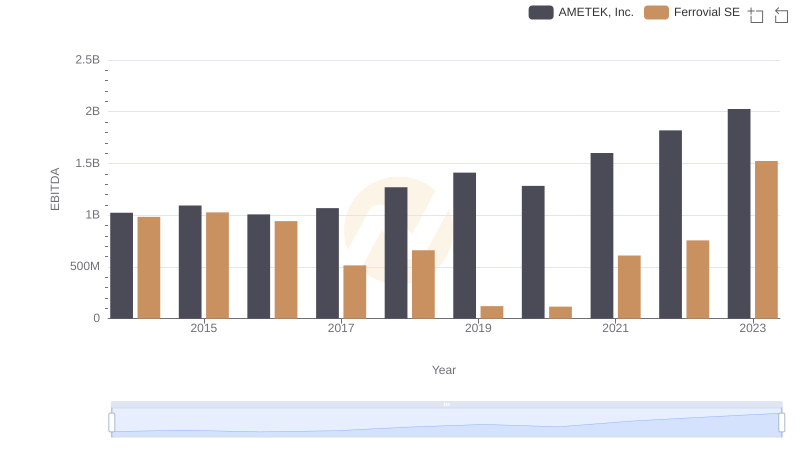
A Side-by-Side Analysis of EBITDA: AMETEK, Inc. and Ferrovial SE
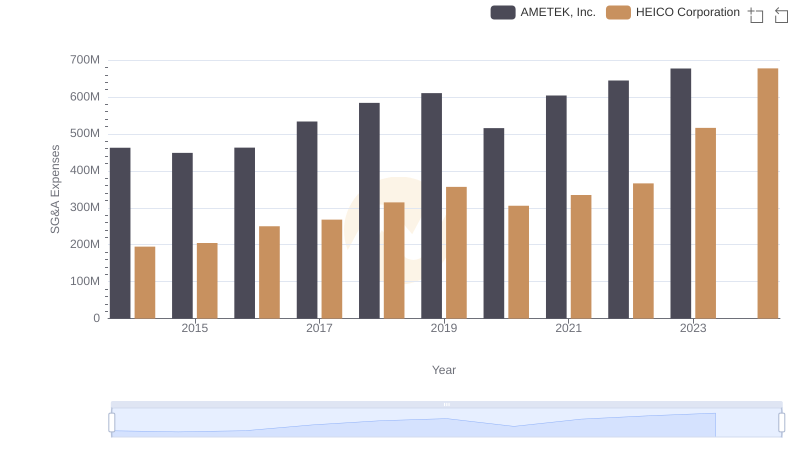
Who Optimizes SG&A Costs Better? AMETEK, Inc. or HEICO Corporation
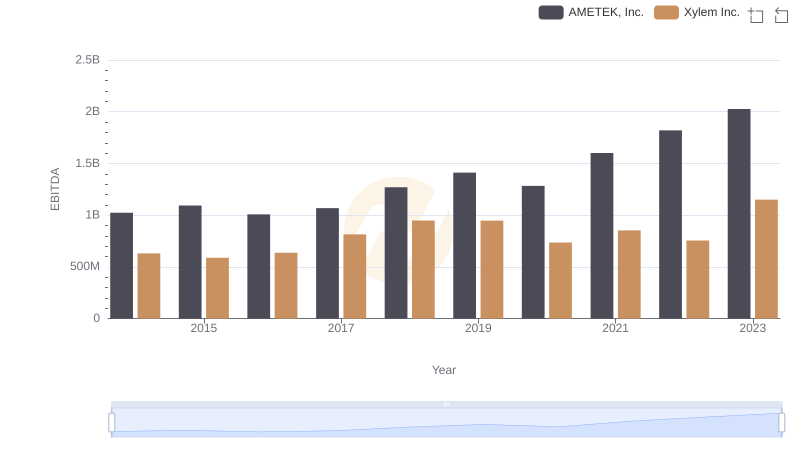
Professional EBITDA Benchmarking: AMETEK, Inc. vs Xylem Inc.
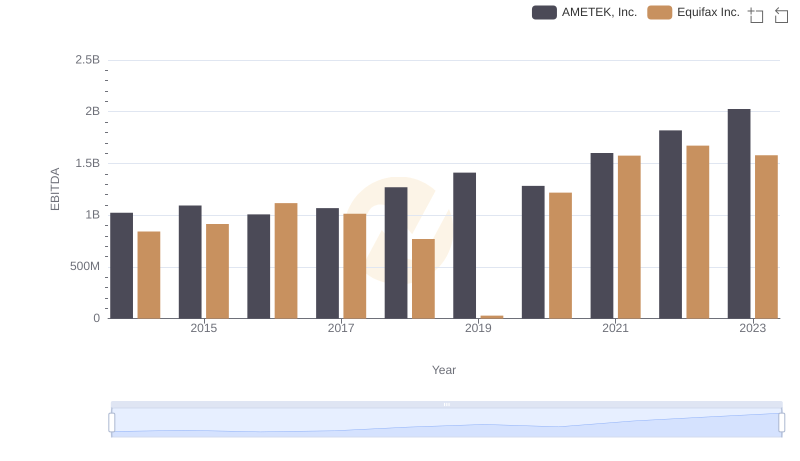
Comparative EBITDA Analysis: AMETEK, Inc. vs Equifax Inc.
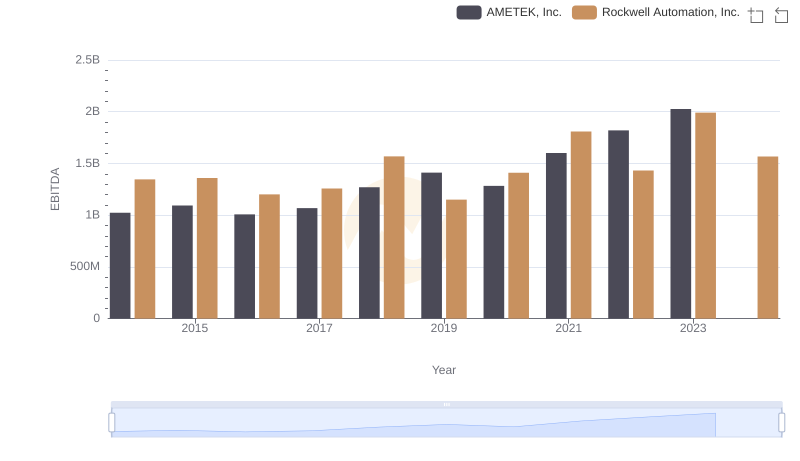
Professional EBITDA Benchmarking: AMETEK, Inc. vs Rockwell Automation, Inc.
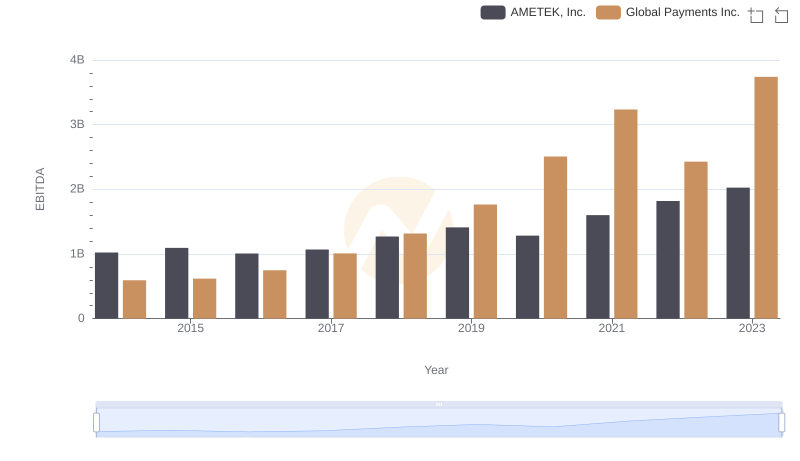
A Side-by-Side Analysis of EBITDA: AMETEK, Inc. and Global Payments Inc.
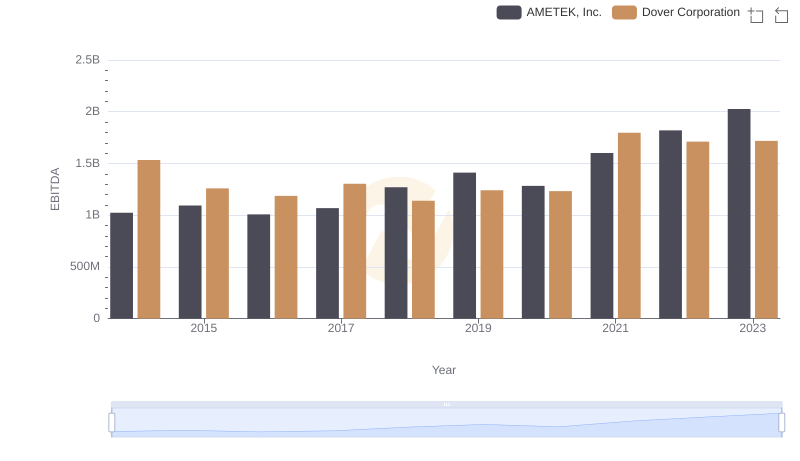
A Professional Review of EBITDA: AMETEK, Inc. Compared to Dover Corporation