| __timestamp | AMETEK, Inc. | Hubbell Incorporated |
|---|---|---|
| Wednesday, January 1, 2014 | 1424947000 | 1109000000 |
| Thursday, January 1, 2015 | 1425015000 | 1091800000 |
| Friday, January 1, 2016 | 1264867000 | 1100700000 |
| Sunday, January 1, 2017 | 1448739000 | 1151900000 |
| Monday, January 1, 2018 | 1659562000 | 1300400000 |
| Tuesday, January 1, 2019 | 1787660000 | 1352700000 |
| Wednesday, January 1, 2020 | 1543514000 | 1209300000 |
| Friday, January 1, 2021 | 1912614000 | 1151500000 |
| Saturday, January 1, 2022 | 2145269000 | 1471600000 |
| Sunday, January 1, 2023 | 2384465001 | 1888100000 |
| Monday, January 1, 2024 | 6941180000 | 1904100000 |
Infusing magic into the data realm
In the competitive landscape of industrial manufacturing, AMETEK, Inc. and Hubbell Incorporated have showcased remarkable growth over the past decade. Since 2014, AMETEK's gross profit has surged by approximately 67%, reaching its peak in 2023. This growth trajectory highlights AMETEK's strategic prowess in expanding its market share and optimizing operational efficiencies.
Conversely, Hubbell Incorporated, while experiencing a more modest growth of around 70% over the same period, has demonstrated resilience and adaptability in a rapidly evolving market. Notably, 2023 marked a significant year for Hubbell, with a gross profit increase of nearly 28% from the previous year, underscoring its robust performance amidst economic challenges.
This analysis not only reflects the financial health of these industrial giants but also offers insights into their strategic directions and market positioning.
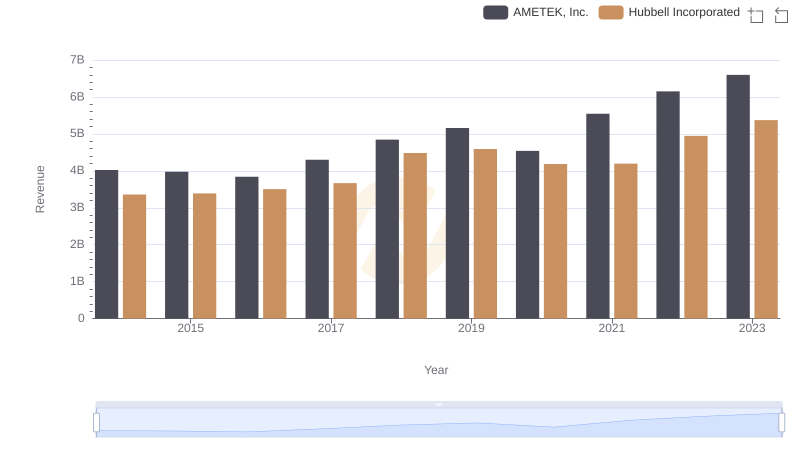
Breaking Down Revenue Trends: AMETEK, Inc. vs Hubbell Incorporated

Cost Insights: Breaking Down AMETEK, Inc. and Hubbell Incorporated's Expenses
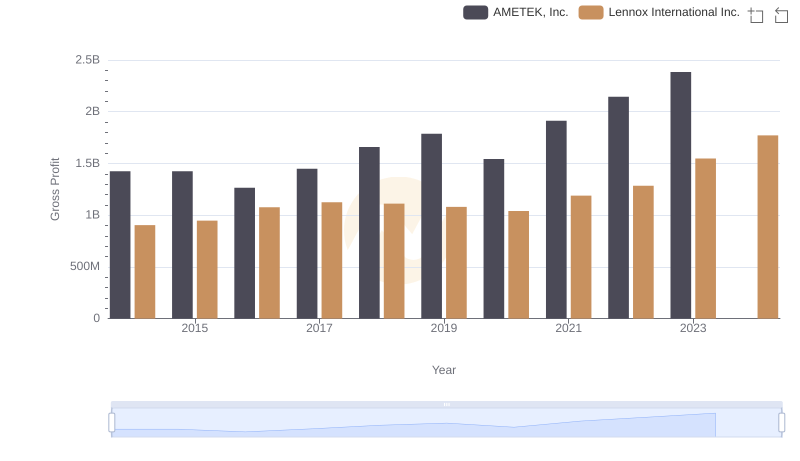
Gross Profit Analysis: Comparing AMETEK, Inc. and Lennox International Inc.
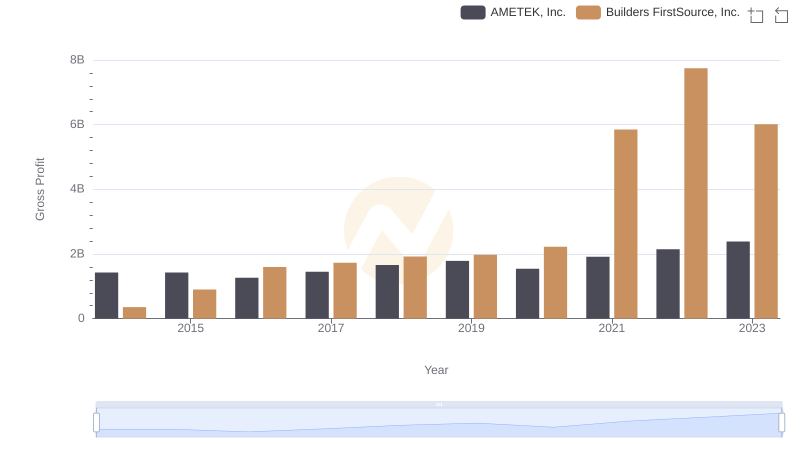
Gross Profit Trends Compared: AMETEK, Inc. vs Builders FirstSource, Inc.

Gross Profit Trends Compared: AMETEK, Inc. vs EMCOR Group, Inc.
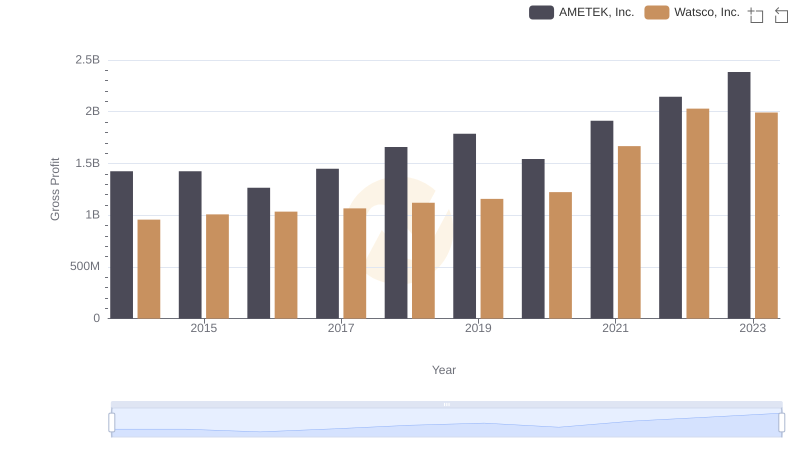
AMETEK, Inc. vs Watsco, Inc.: A Gross Profit Performance Breakdown
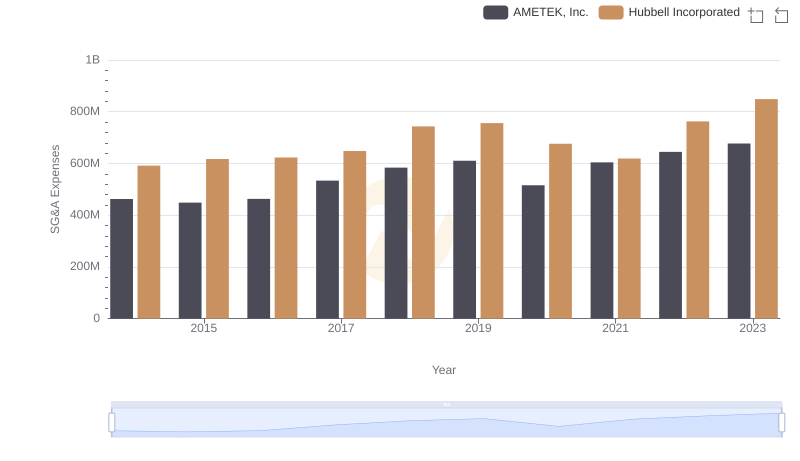
Breaking Down SG&A Expenses: AMETEK, Inc. vs Hubbell Incorporated