| __timestamp | AMETEK, Inc. | HEICO Corporation |
|---|---|---|
| Wednesday, January 1, 2014 | 2597017000 | 733999000 |
| Thursday, January 1, 2015 | 2549280000 | 754469000 |
| Friday, January 1, 2016 | 2575220000 | 860766000 |
| Sunday, January 1, 2017 | 2851431000 | 950088000 |
| Monday, January 1, 2018 | 3186310000 | 1087006000 |
| Tuesday, January 1, 2019 | 3370897000 | 1241807000 |
| Wednesday, January 1, 2020 | 2996515000 | 1104882000 |
| Friday, January 1, 2021 | 3633900000 | 1138259000 |
| Saturday, January 1, 2022 | 4005261000 | 1345563000 |
| Sunday, January 1, 2023 | 4212484999 | 1814617000 |
| Monday, January 1, 2024 | 0 | 2355943000 |
Infusing magic into the data realm
In the competitive landscape of the industrial sector, AMETEK, Inc. and HEICO Corporation have been pivotal players. Over the past decade, AMETEK's cost of revenue has shown a steady upward trajectory, increasing by approximately 62% from 2014 to 2023. In contrast, HEICO Corporation, while starting with a lower cost of revenue, has experienced a remarkable growth of nearly 148% in the same period. This divergence highlights the distinct operational strategies and market positioning of these two giants.
These trends underscore the dynamic nature of the industrial sector, where strategic decisions and market conditions shape financial outcomes.
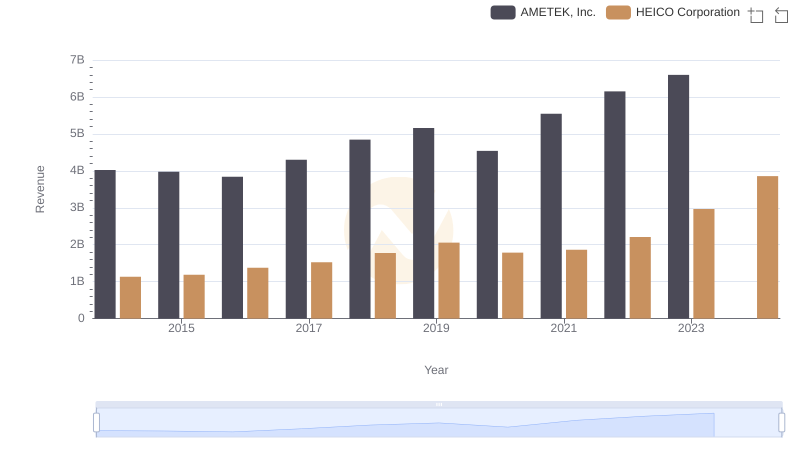
AMETEK, Inc. and HEICO Corporation: A Comprehensive Revenue Analysis
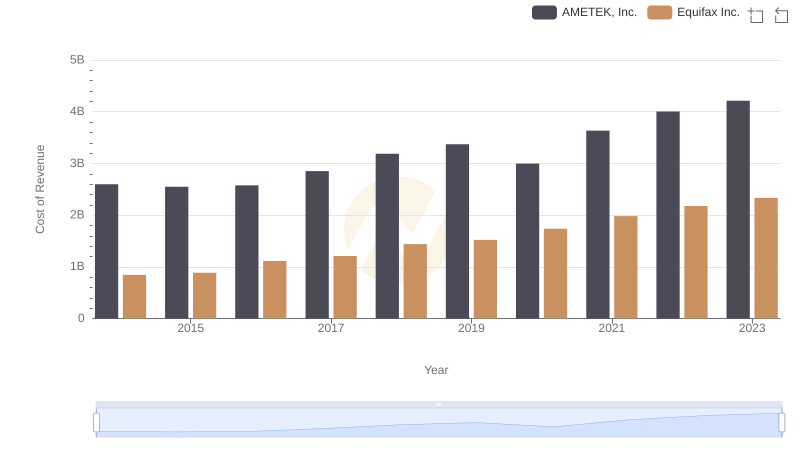
AMETEK, Inc. vs Equifax Inc.: Efficiency in Cost of Revenue Explored
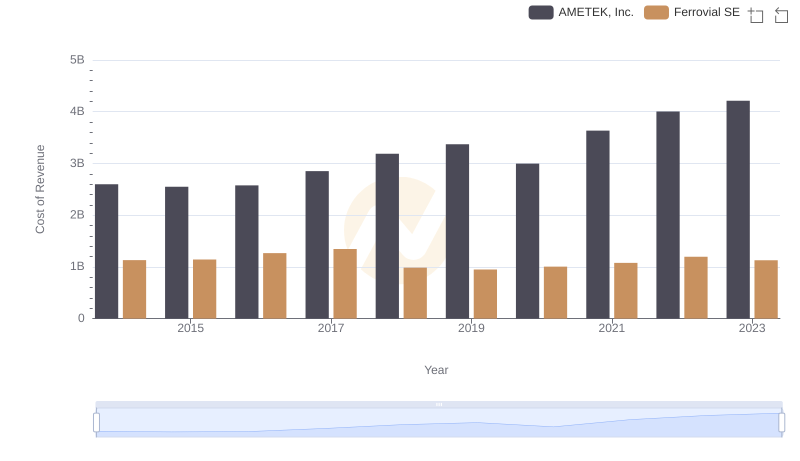
Cost of Revenue Trends: AMETEK, Inc. vs Ferrovial SE
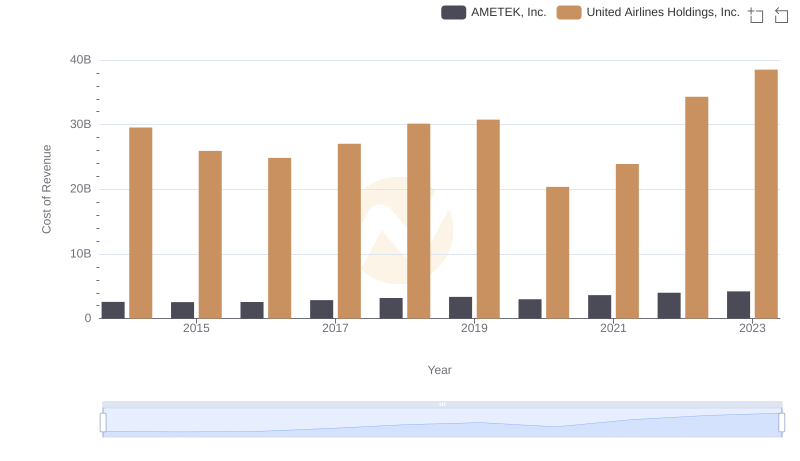
Cost of Revenue Trends: AMETEK, Inc. vs United Airlines Holdings, Inc.
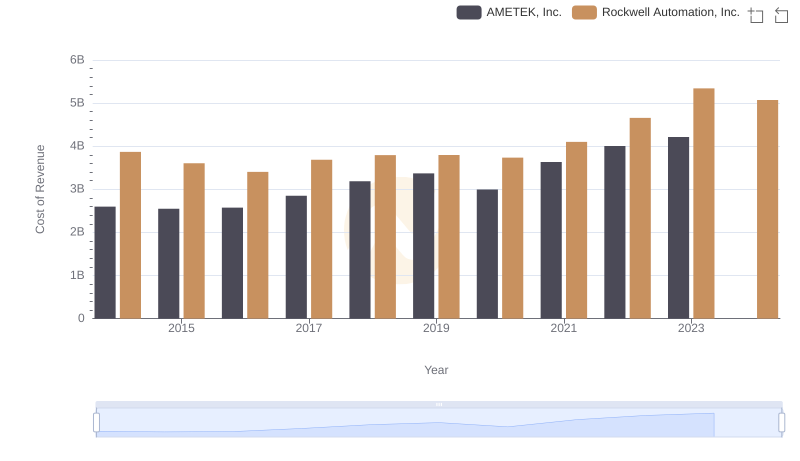
Cost of Revenue Trends: AMETEK, Inc. vs Rockwell Automation, Inc.
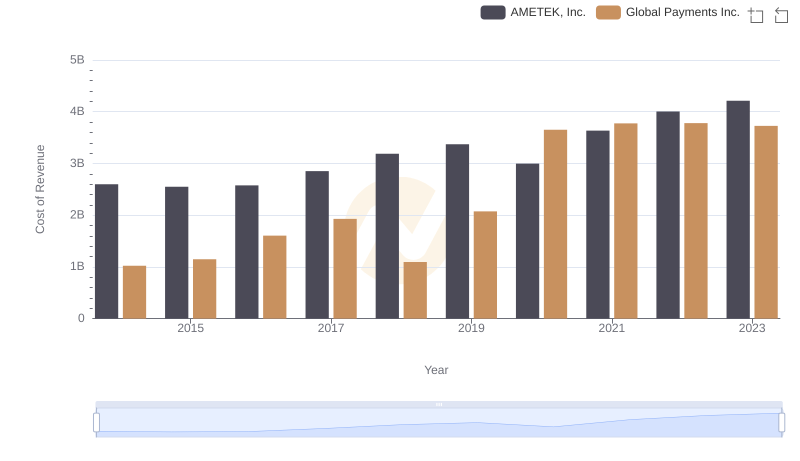
Cost of Revenue Comparison: AMETEK, Inc. vs Global Payments Inc.
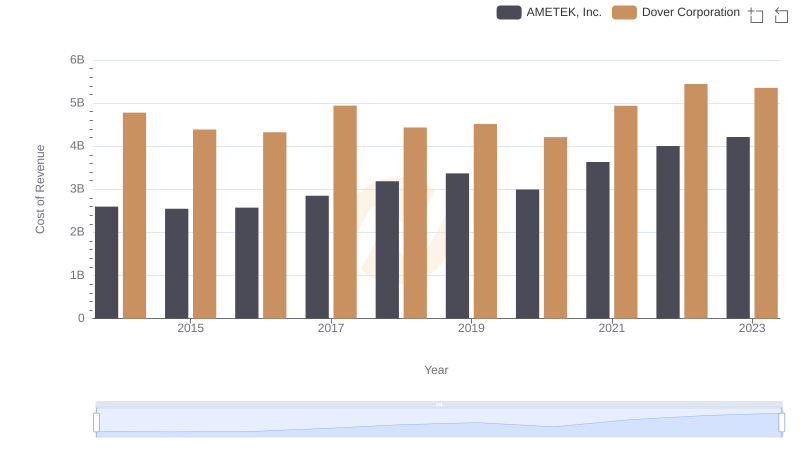
Cost of Revenue: Key Insights for AMETEK, Inc. and Dover Corporation
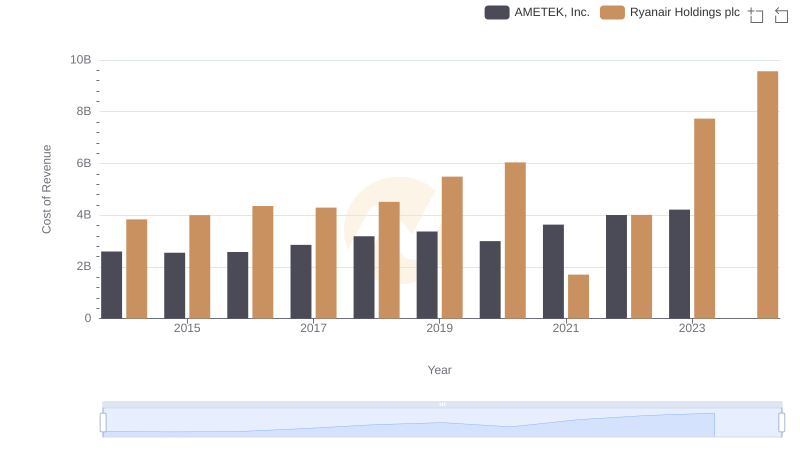
AMETEK, Inc. vs Ryanair Holdings plc: Efficiency in Cost of Revenue Explored
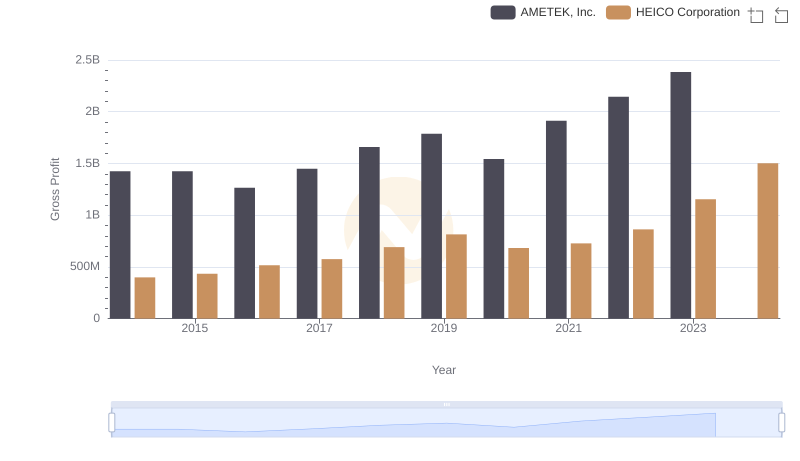
Gross Profit Trends Compared: AMETEK, Inc. vs HEICO Corporation
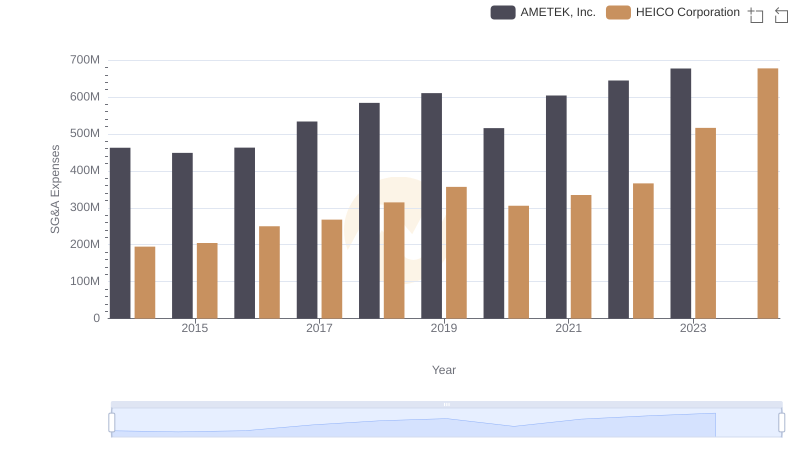
Who Optimizes SG&A Costs Better? AMETEK, Inc. or HEICO Corporation
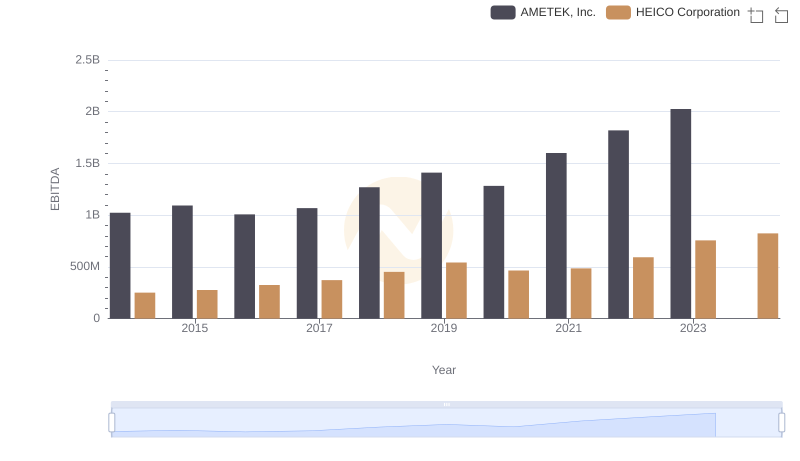
AMETEK, Inc. and HEICO Corporation: A Detailed Examination of EBITDA Performance