| __timestamp | AMETEK, Inc. | HEICO Corporation |
|---|---|---|
| Wednesday, January 1, 2014 | 4021964000 | 1132311000 |
| Thursday, January 1, 2015 | 3974295000 | 1188648000 |
| Friday, January 1, 2016 | 3840087000 | 1376258000 |
| Sunday, January 1, 2017 | 4300170000 | 1524813000 |
| Monday, January 1, 2018 | 4845872000 | 1777721000 |
| Tuesday, January 1, 2019 | 5158557000 | 2055647000 |
| Wednesday, January 1, 2020 | 4540029000 | 1787009000 |
| Friday, January 1, 2021 | 5546514000 | 1865682000 |
| Saturday, January 1, 2022 | 6150530000 | 2208322000 |
| Sunday, January 1, 2023 | 6596950000 | 2968105000 |
| Monday, January 1, 2024 | 6941180000 | 3857669000 |
Unleashing the power of data
In the ever-evolving landscape of industrial technology, AMETEK, Inc. and HEICO Corporation have emerged as formidable players. Over the past decade, AMETEK has demonstrated a robust growth trajectory, with its revenue surging by approximately 64% from 2014 to 2023. This growth underscores AMETEK's strategic prowess in expanding its market footprint and enhancing its product offerings.
Conversely, HEICO Corporation has also shown impressive growth, with its revenue more than doubling during the same period. This remarkable 170% increase highlights HEICO's innovative approach and its ability to capture new market opportunities.
While AMETEK's revenue peaked in 2023, HEICO's data for 2024 suggests continued momentum, albeit with some missing data points for AMETEK. This analysis provides a compelling snapshot of how these two industry leaders are navigating the competitive landscape, each carving out a unique path to success.
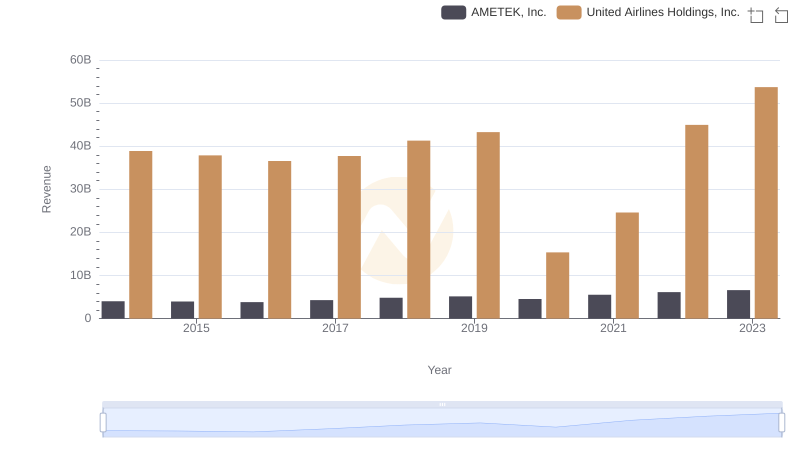
Breaking Down Revenue Trends: AMETEK, Inc. vs United Airlines Holdings, Inc.
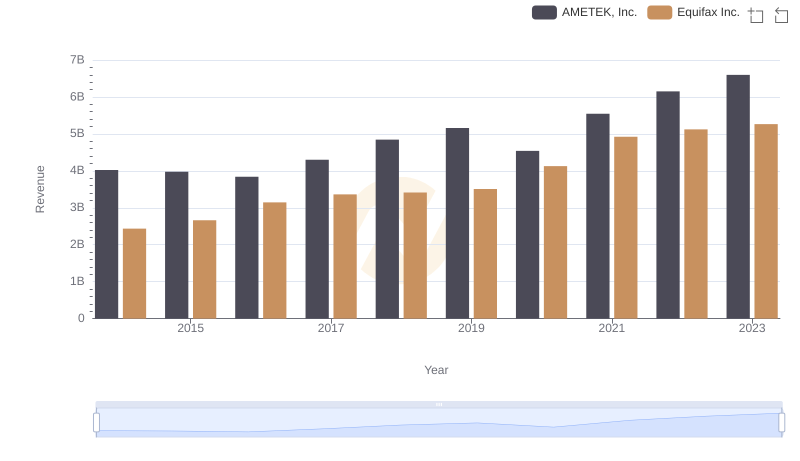
AMETEK, Inc. or Equifax Inc.: Who Leads in Yearly Revenue?
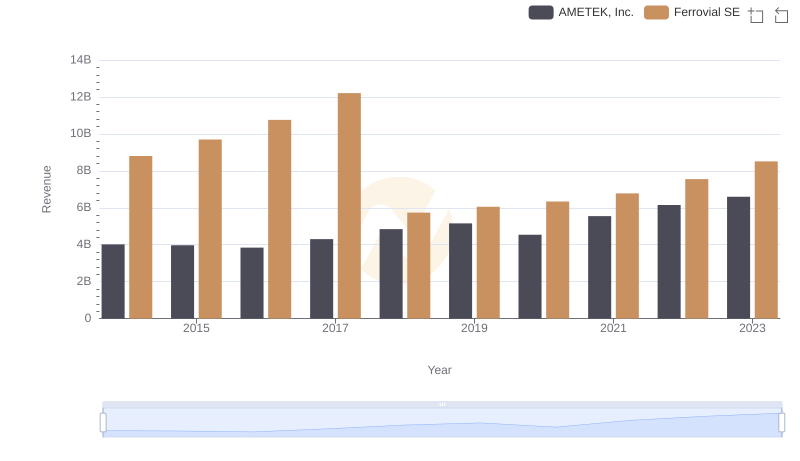
AMETEK, Inc. or Ferrovial SE: Who Leads in Yearly Revenue?
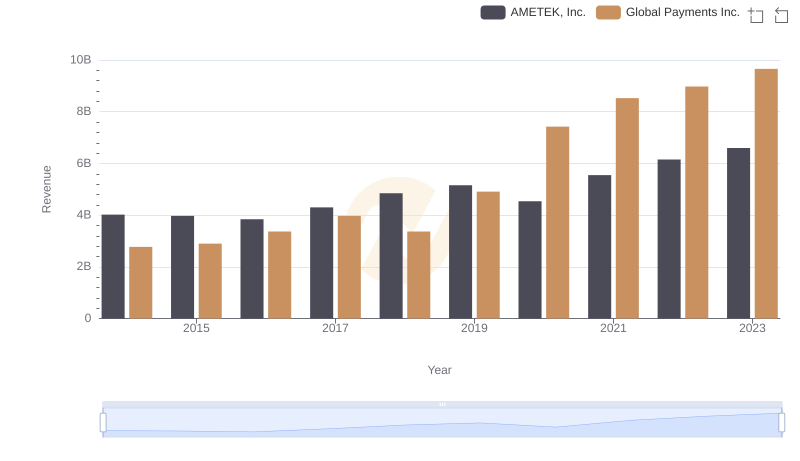
AMETEK, Inc. or Global Payments Inc.: Who Leads in Yearly Revenue?
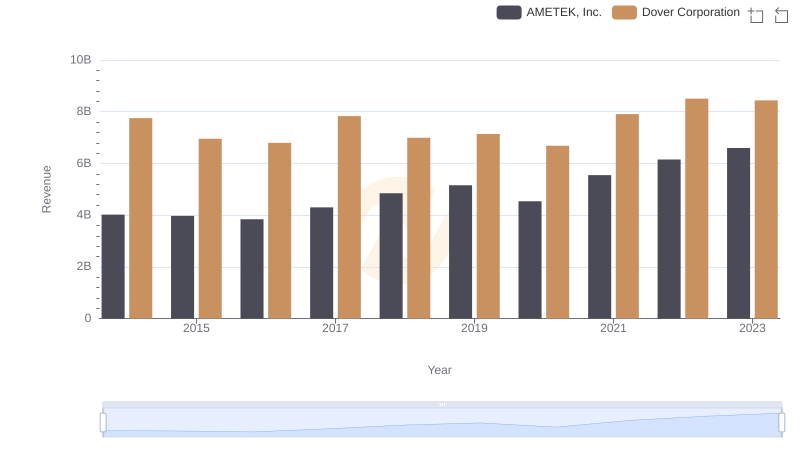
AMETEK, Inc. vs Dover Corporation: Examining Key Revenue Metrics
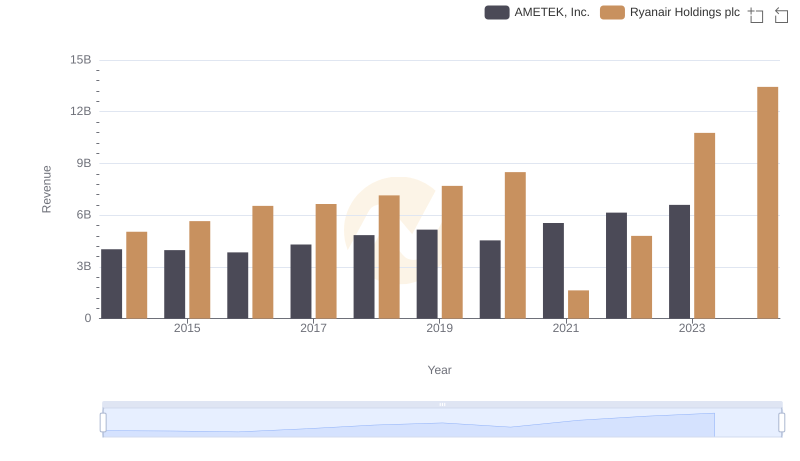
AMETEK, Inc. vs Ryanair Holdings plc: Examining Key Revenue Metrics
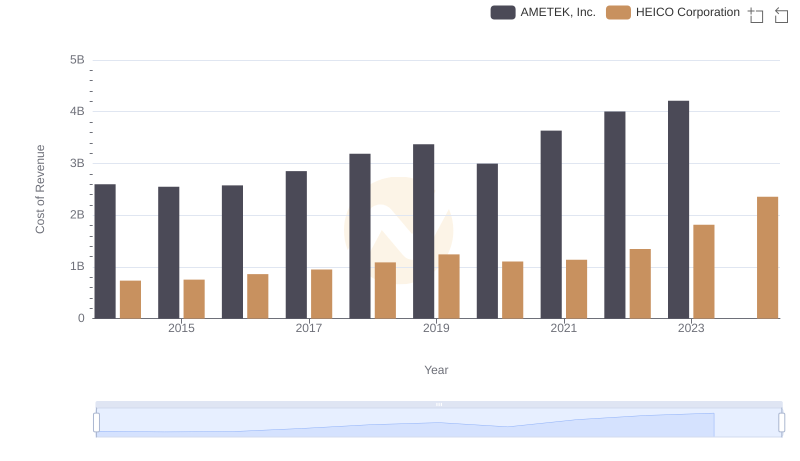
Cost of Revenue Comparison: AMETEK, Inc. vs HEICO Corporation
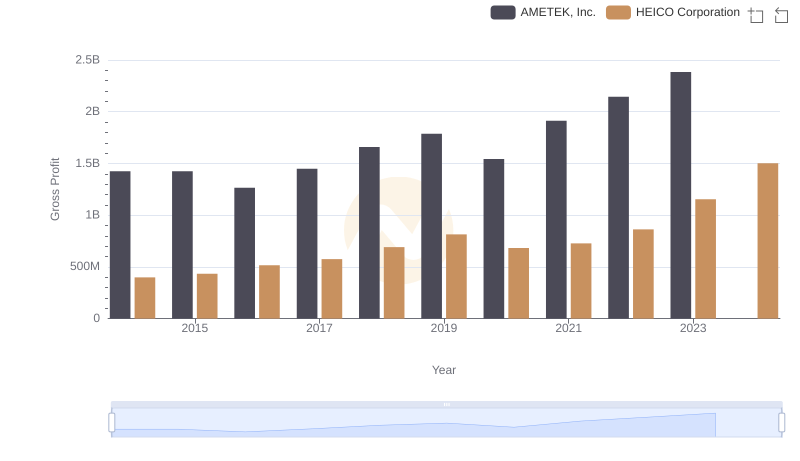
Gross Profit Trends Compared: AMETEK, Inc. vs HEICO Corporation
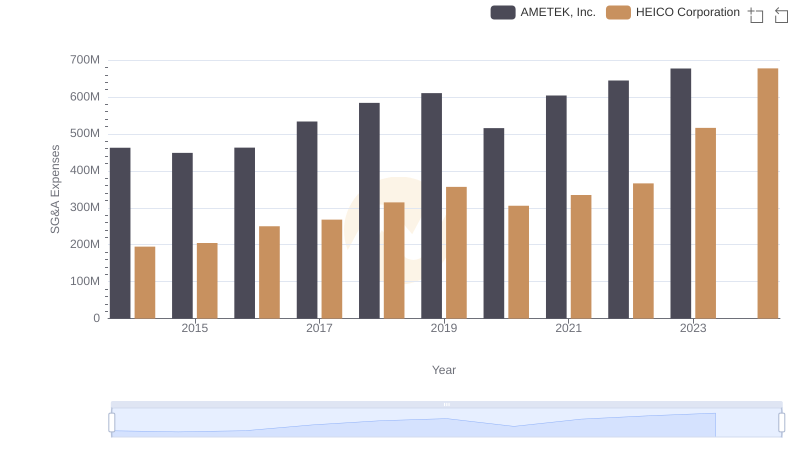
Who Optimizes SG&A Costs Better? AMETEK, Inc. or HEICO Corporation
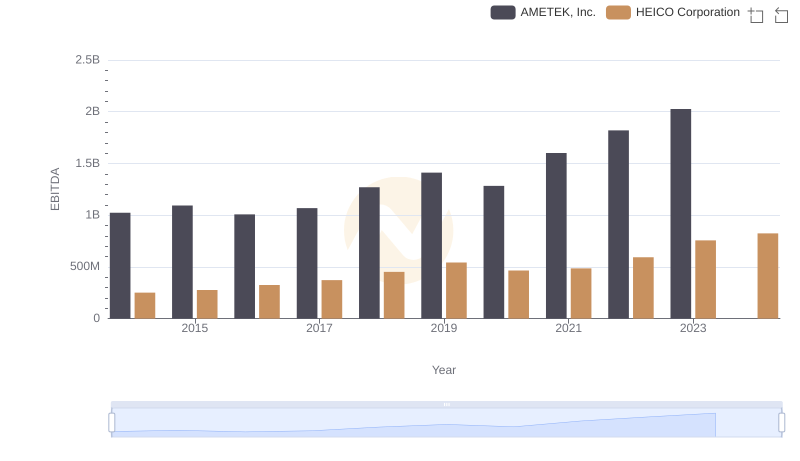
AMETEK, Inc. and HEICO Corporation: A Detailed Examination of EBITDA Performance