| __timestamp | Elbit Systems Ltd. | Lennox International Inc. |
|---|---|---|
| Wednesday, January 1, 2014 | 356171000 | 573700000 |
| Thursday, January 1, 2015 | 385059000 | 580500000 |
| Friday, January 1, 2016 | 422390000 | 621000000 |
| Sunday, January 1, 2017 | 413560000 | 637700000 |
| Monday, January 1, 2018 | 441362000 | 608200000 |
| Tuesday, January 1, 2019 | 516149000 | 585900000 |
| Wednesday, January 1, 2020 | 514638000 | 555900000 |
| Friday, January 1, 2021 | 559113000 | 598900000 |
| Saturday, January 1, 2022 | 639067000 | 627200000 |
| Sunday, January 1, 2023 | 696022000 | 705500000 |
| Monday, January 1, 2024 | 730600000 |
Cracking the code
In the competitive landscape of global business, understanding the financial strategies of industry leaders is crucial. This analysis delves into the Selling, General, and Administrative (SG&A) expenses of Lennox International Inc. and Elbit Systems Ltd. over the past decade.
From 2014 to 2023, Lennox International Inc. consistently outpaced Elbit Systems Ltd. in SG&A expenses, with a notable 23% higher average. Lennox's expenses peaked in 2023, reaching approximately 7.1 billion, marking a 23% increase from 2014. Meanwhile, Elbit Systems Ltd. saw a steady rise, culminating in a 96% increase by 2023.
The upward trend in SG&A expenses for both companies suggests strategic investments in growth and operational efficiency. However, the absence of data for Elbit Systems Ltd. in 2024 leaves room for speculation on future financial strategies. This comparative analysis offers valuable insights for investors and industry analysts alike, highlighting the dynamic nature of corporate financial management.
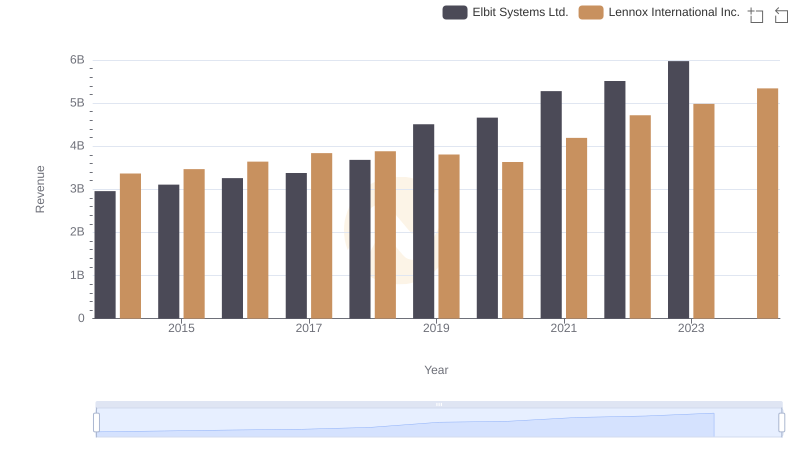
Lennox International Inc. or Elbit Systems Ltd.: Who Leads in Yearly Revenue?
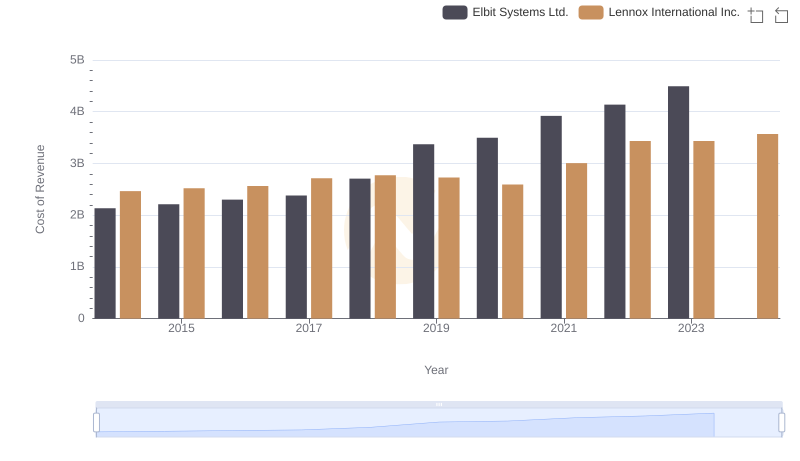
Cost of Revenue: Key Insights for Lennox International Inc. and Elbit Systems Ltd.
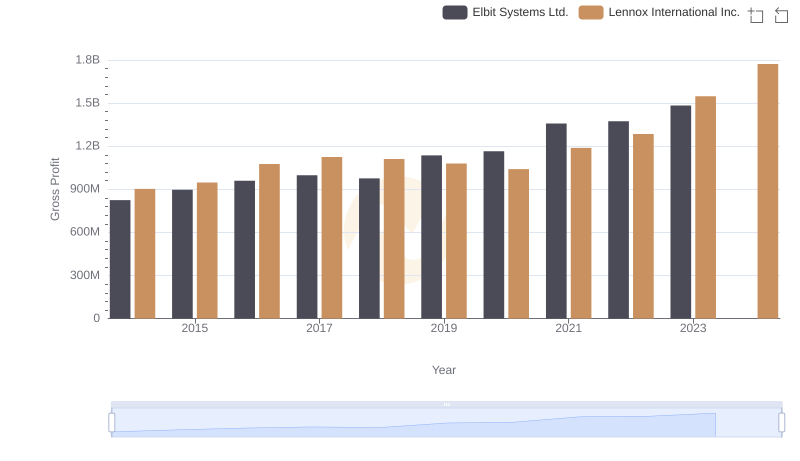
Gross Profit Comparison: Lennox International Inc. and Elbit Systems Ltd. Trends
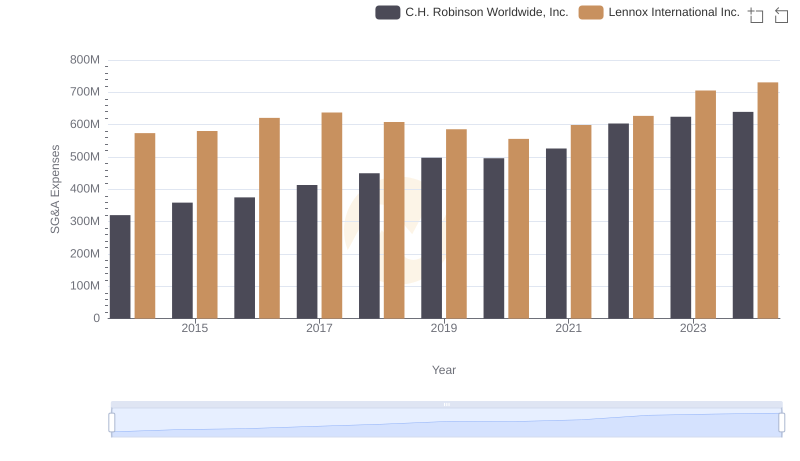
Comparing SG&A Expenses: Lennox International Inc. vs C.H. Robinson Worldwide, Inc. Trends and Insights
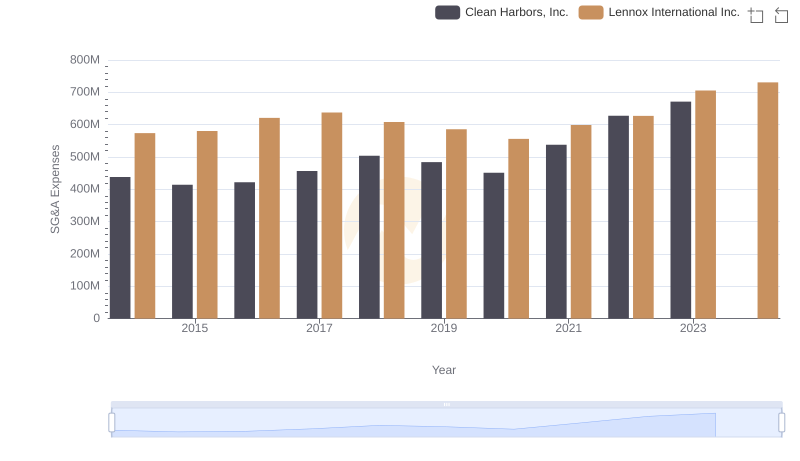
Lennox International Inc. and Clean Harbors, Inc.: SG&A Spending Patterns Compared
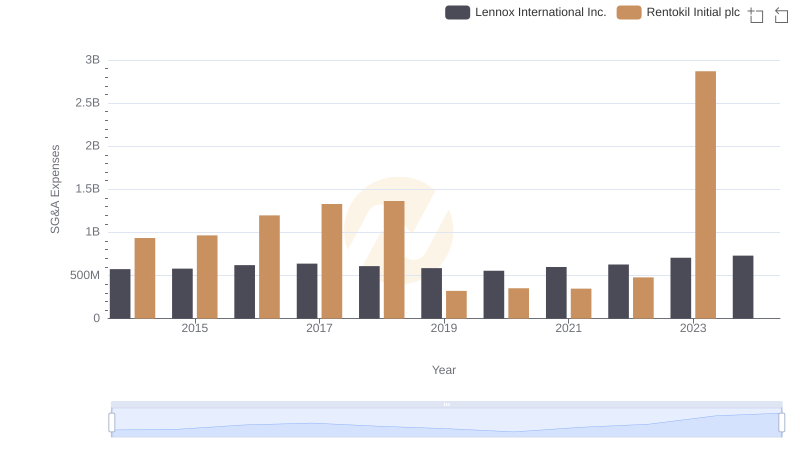
Who Optimizes SG&A Costs Better? Lennox International Inc. or Rentokil Initial plc
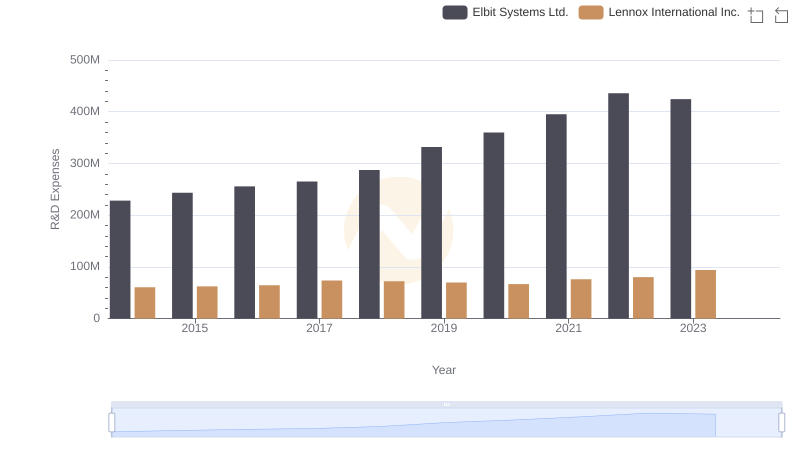
Lennox International Inc. vs Elbit Systems Ltd.: Strategic Focus on R&D Spending
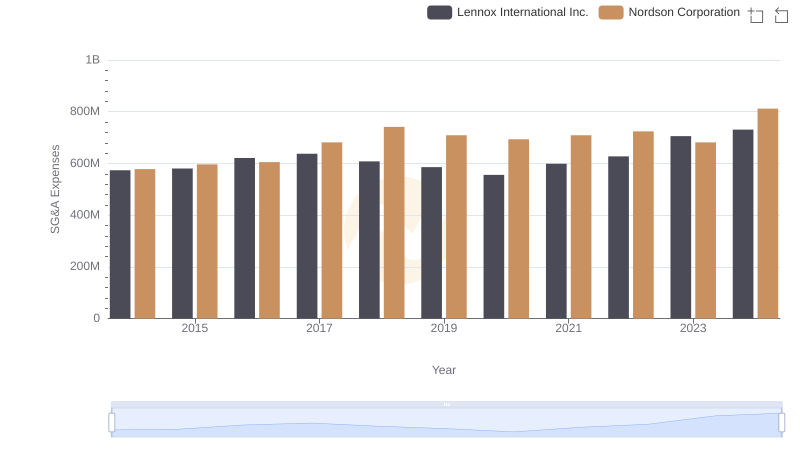
Breaking Down SG&A Expenses: Lennox International Inc. vs Nordson Corporation
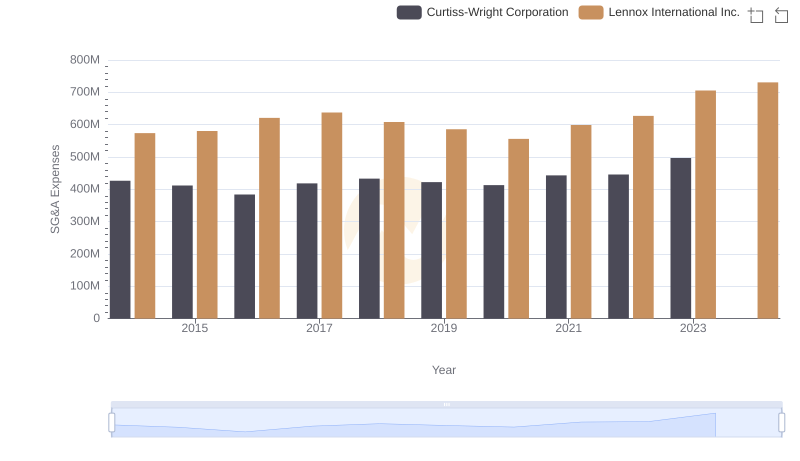
SG&A Efficiency Analysis: Comparing Lennox International Inc. and Curtiss-Wright Corporation
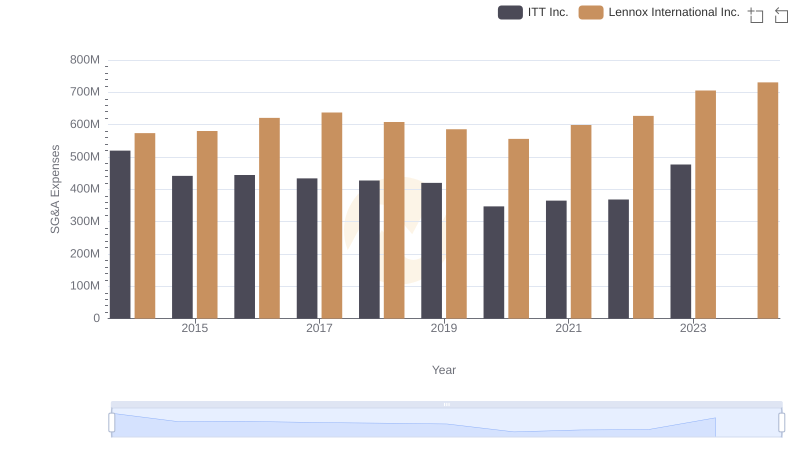
Who Optimizes SG&A Costs Better? Lennox International Inc. or ITT Inc.
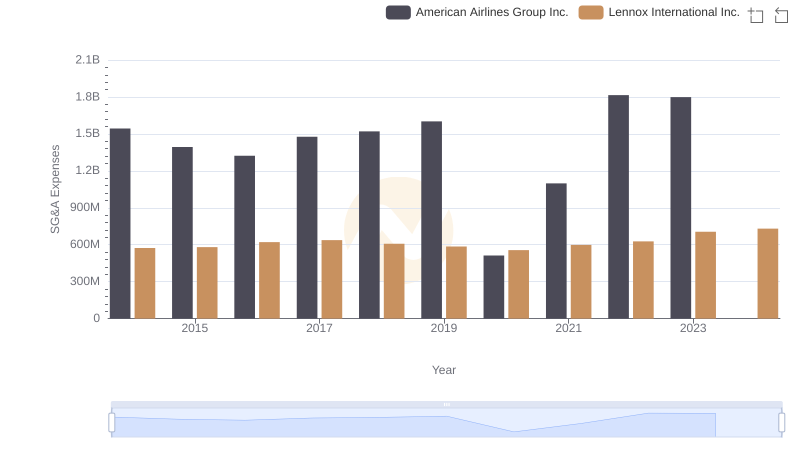
Lennox International Inc. and American Airlines Group Inc.: SG&A Spending Patterns Compared
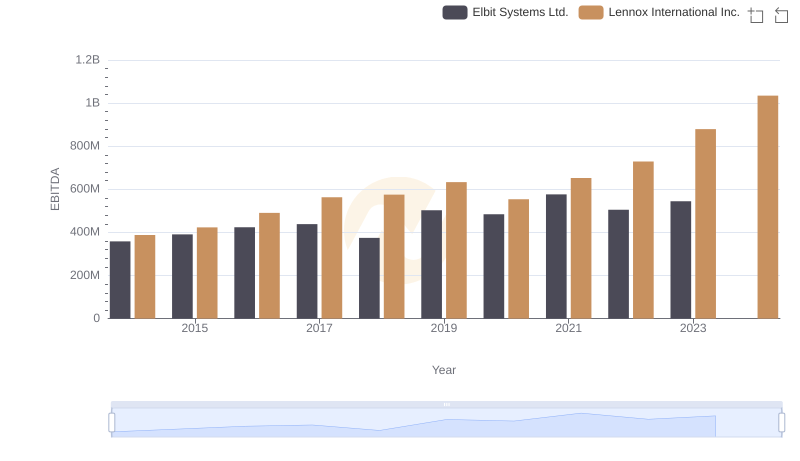
Professional EBITDA Benchmarking: Lennox International Inc. vs Elbit Systems Ltd.