| __timestamp | Elbit Systems Ltd. | Lennox International Inc. |
|---|---|---|
| Wednesday, January 1, 2014 | 358274000 | 387700000 |
| Thursday, January 1, 2015 | 390932000 | 423600000 |
| Friday, January 1, 2016 | 424003291 | 490800000 |
| Sunday, January 1, 2017 | 438616108 | 562900000 |
| Monday, January 1, 2018 | 374866620 | 575200000 |
| Tuesday, January 1, 2019 | 502866000 | 633300000 |
| Wednesday, January 1, 2020 | 484464000 | 553900000 |
| Friday, January 1, 2021 | 576645646 | 652500000 |
| Saturday, January 1, 2022 | 505269000 | 729000000 |
| Sunday, January 1, 2023 | 544811000 | 879500000 |
| Monday, January 1, 2024 | 1034800000 |
In pursuit of knowledge
In the ever-evolving landscape of global business, understanding financial performance is crucial. This analysis delves into the EBITDA trends of Lennox International Inc. and Elbit Systems Ltd. from 2014 to 2023. Over this decade, Lennox International Inc. has consistently outperformed Elbit Systems Ltd., with an average EBITDA approximately 37% higher. Notably, Lennox's EBITDA surged by 127% from 2014 to 2023, peaking at over $1 billion in 2024, while Elbit Systems saw a 52% increase, reaching its highest in 2021. The data highlights Lennox's robust growth trajectory, particularly in the last five years, where it maintained a steady upward trend. Meanwhile, Elbit Systems experienced fluctuations, with a notable dip in 2018. This comparative analysis underscores the dynamic nature of financial performance and the importance of strategic positioning in the market.
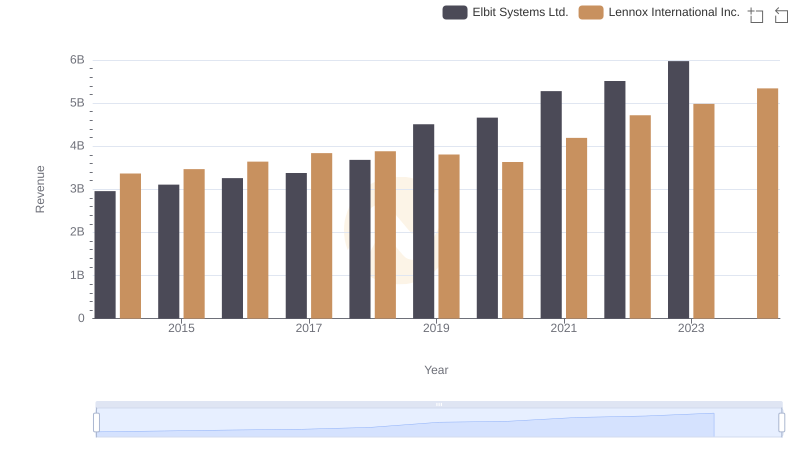
Lennox International Inc. or Elbit Systems Ltd.: Who Leads in Yearly Revenue?
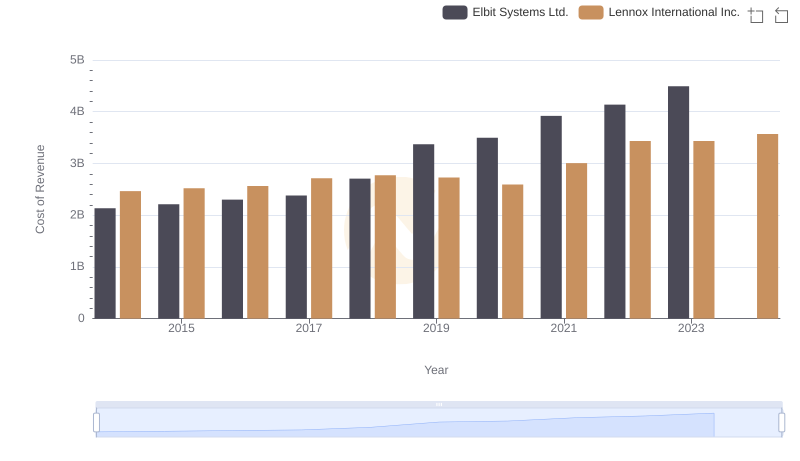
Cost of Revenue: Key Insights for Lennox International Inc. and Elbit Systems Ltd.
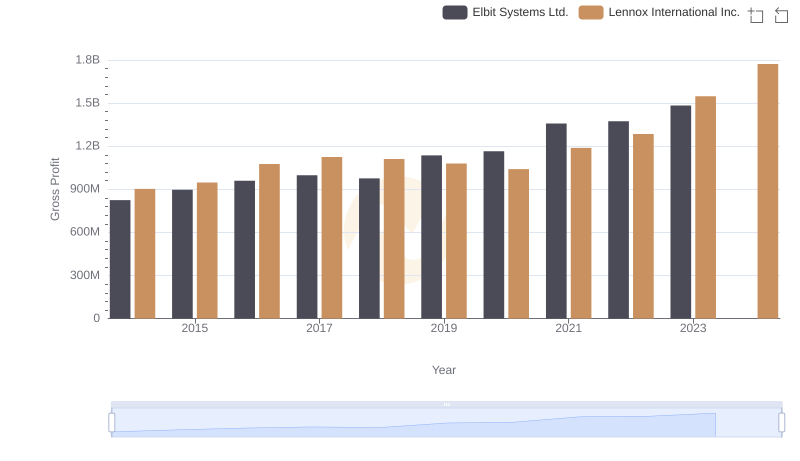
Gross Profit Comparison: Lennox International Inc. and Elbit Systems Ltd. Trends
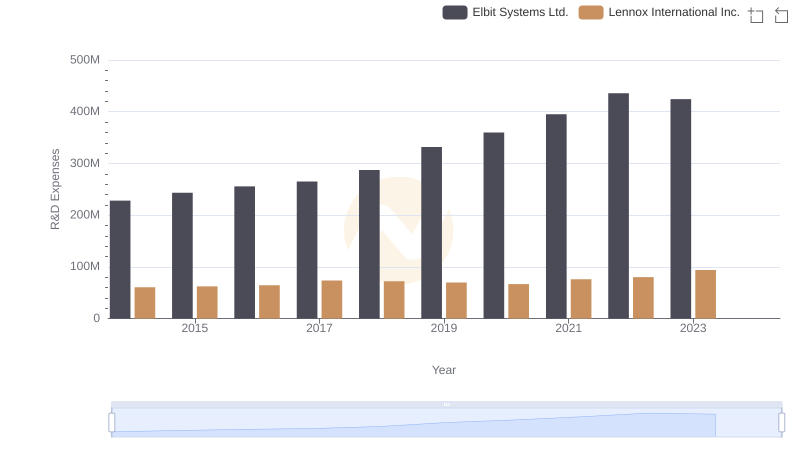
Lennox International Inc. vs Elbit Systems Ltd.: Strategic Focus on R&D Spending
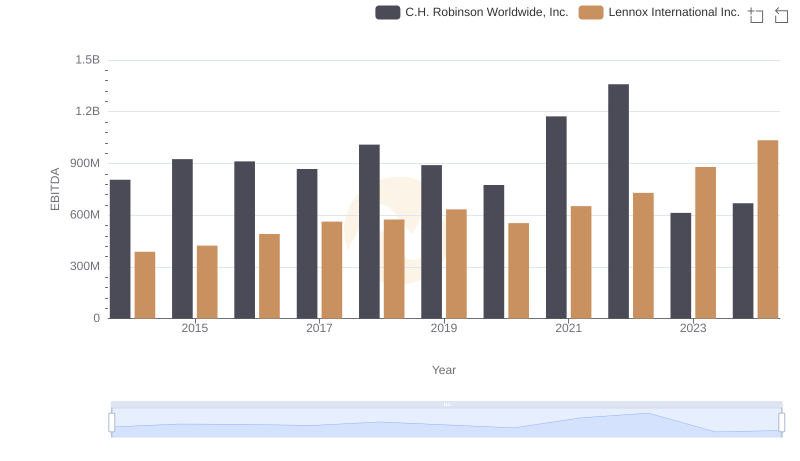
A Professional Review of EBITDA: Lennox International Inc. Compared to C.H. Robinson Worldwide, Inc.
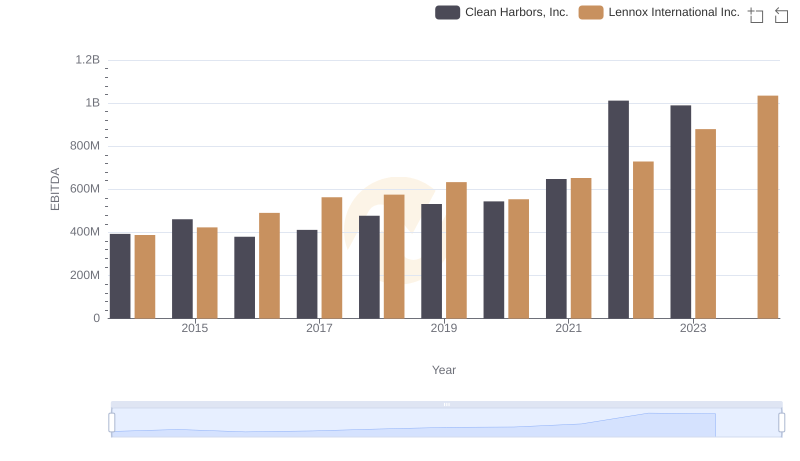
Comparative EBITDA Analysis: Lennox International Inc. vs Clean Harbors, Inc.
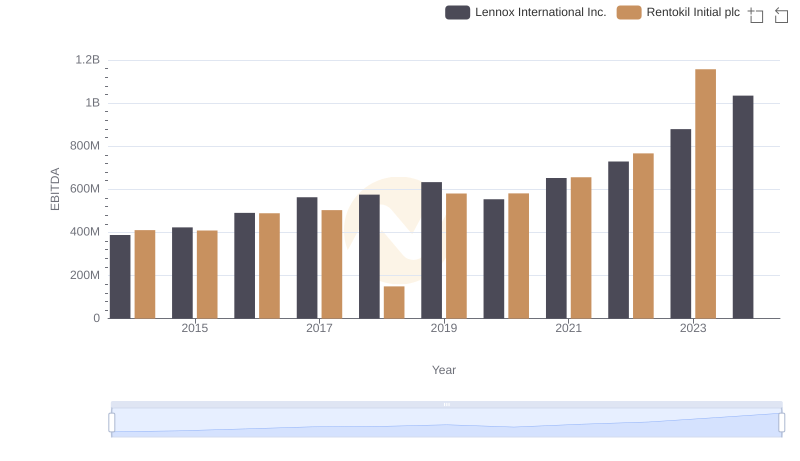
Lennox International Inc. vs Rentokil Initial plc: In-Depth EBITDA Performance Comparison
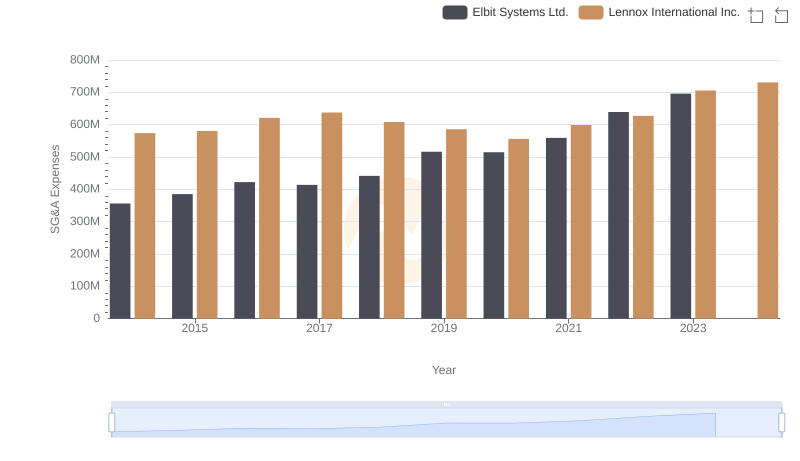
Comparing SG&A Expenses: Lennox International Inc. vs Elbit Systems Ltd. Trends and Insights
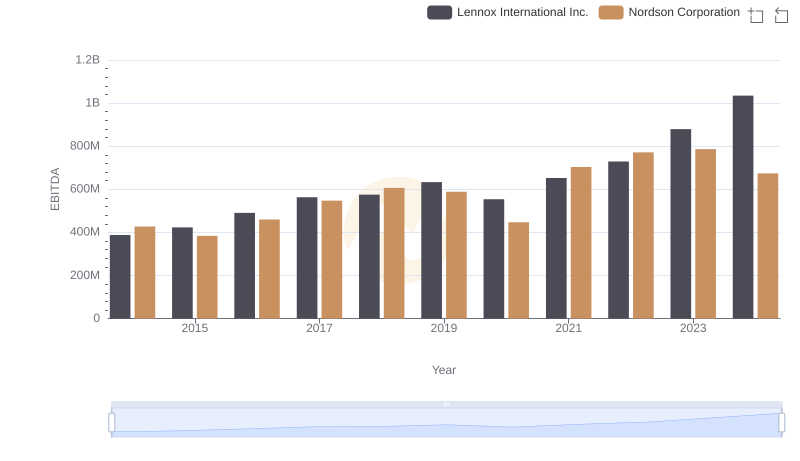
Lennox International Inc. vs Nordson Corporation: In-Depth EBITDA Performance Comparison

Professional EBITDA Benchmarking: Lennox International Inc. vs Curtiss-Wright Corporation
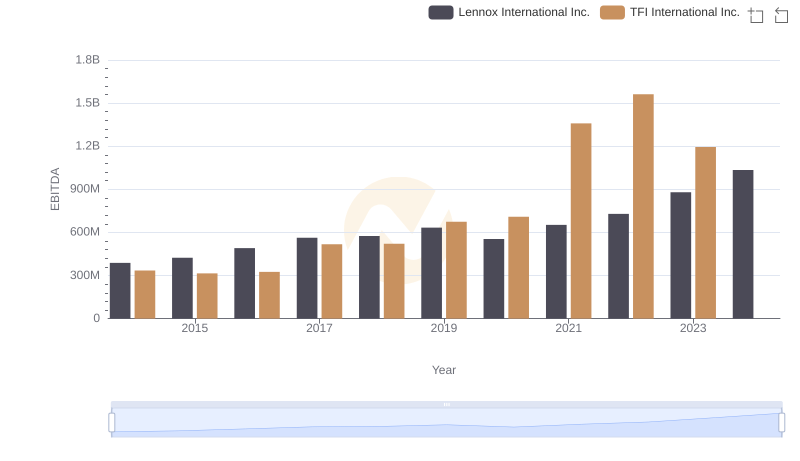
A Professional Review of EBITDA: Lennox International Inc. Compared to TFI International Inc.
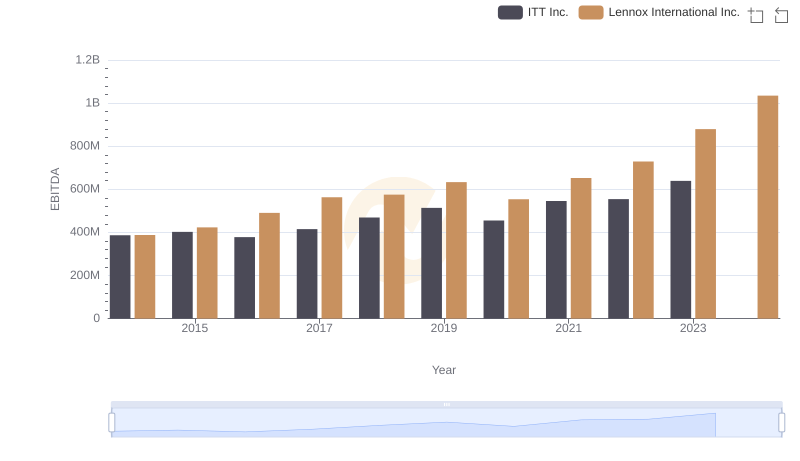
Comprehensive EBITDA Comparison: Lennox International Inc. vs ITT Inc.