| __timestamp | International Business Machines Corporation | Intuit Inc. |
|---|---|---|
| Wednesday, January 1, 2014 | 46407000000 | 3838000000 |
| Thursday, January 1, 2015 | 40684000000 | 3467000000 |
| Friday, January 1, 2016 | 38516000000 | 3942000000 |
| Sunday, January 1, 2017 | 36943000000 | 4368000000 |
| Monday, January 1, 2018 | 36936000000 | 4987000000 |
| Tuesday, January 1, 2019 | 31533000000 | 5617000000 |
| Wednesday, January 1, 2020 | 30865000000 | 6301000000 |
| Friday, January 1, 2021 | 31486000000 | 7950000000 |
| Saturday, January 1, 2022 | 32687000000 | 10320000000 |
| Sunday, January 1, 2023 | 34300000000 | 11225000000 |
| Monday, January 1, 2024 | 35551000000 | 12820000000 |
Infusing magic into the data realm
In the ever-evolving landscape of technology giants, the financial performance of companies like International Business Machines Corporation (IBM) and Intuit Inc. offers a fascinating glimpse into their strategic maneuvers. Over the past decade, IBM's gross profit has seen a decline of approximately 23%, from its peak in 2014 to 2024. This trend reflects IBM's ongoing transformation and adaptation to new market demands. In contrast, Intuit Inc. has experienced a remarkable growth trajectory, with its gross profit surging by over 230% during the same period. This growth underscores Intuit's successful expansion in the financial software sector, capitalizing on the increasing demand for digital financial solutions. As we look to the future, these trends highlight the dynamic nature of the tech industry and the importance of innovation and adaptability in maintaining competitive advantage.
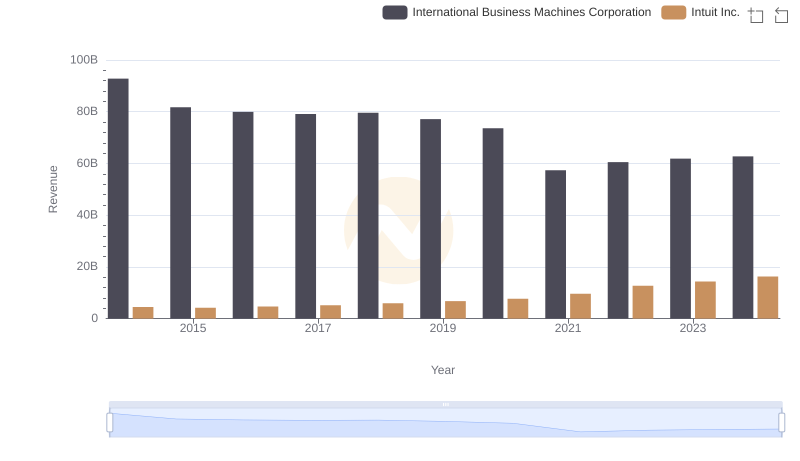
Annual Revenue Comparison: International Business Machines Corporation vs Intuit Inc.
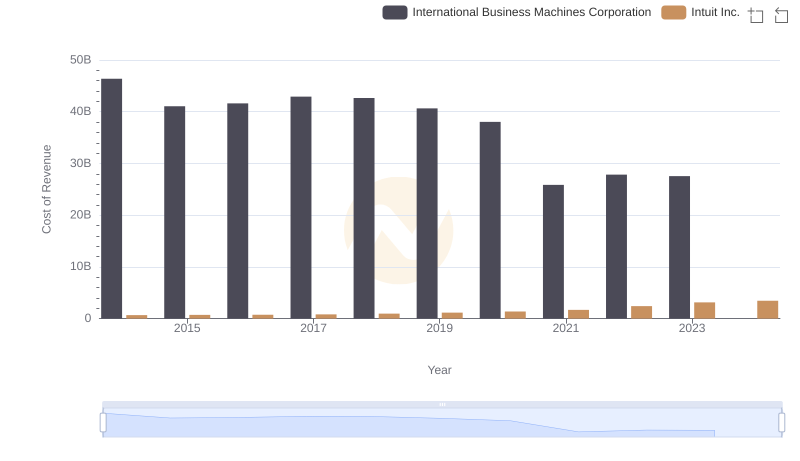
Cost of Revenue Comparison: International Business Machines Corporation vs Intuit Inc.
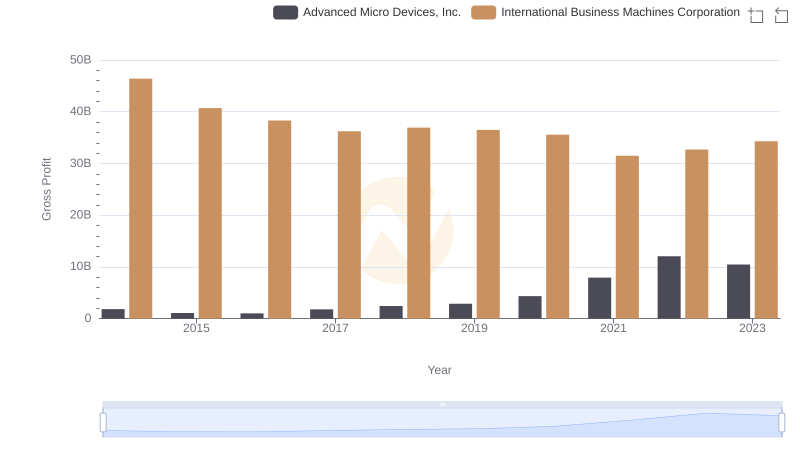
Key Insights on Gross Profit: International Business Machines Corporation vs Advanced Micro Devices, Inc.
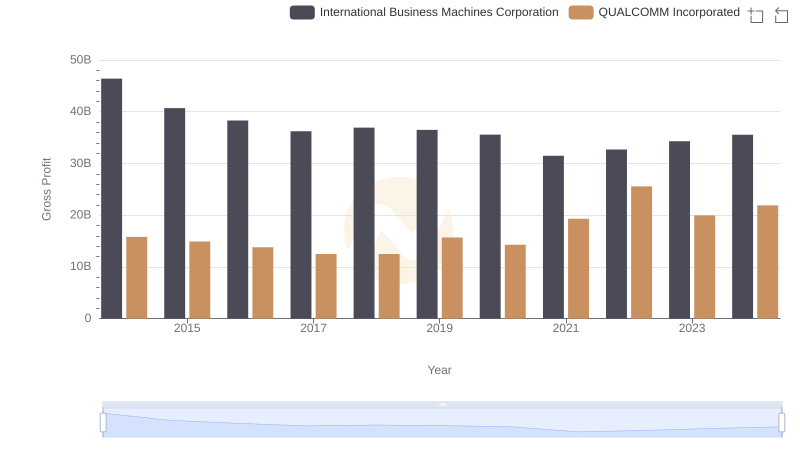
Gross Profit Trends Compared: International Business Machines Corporation vs QUALCOMM Incorporated
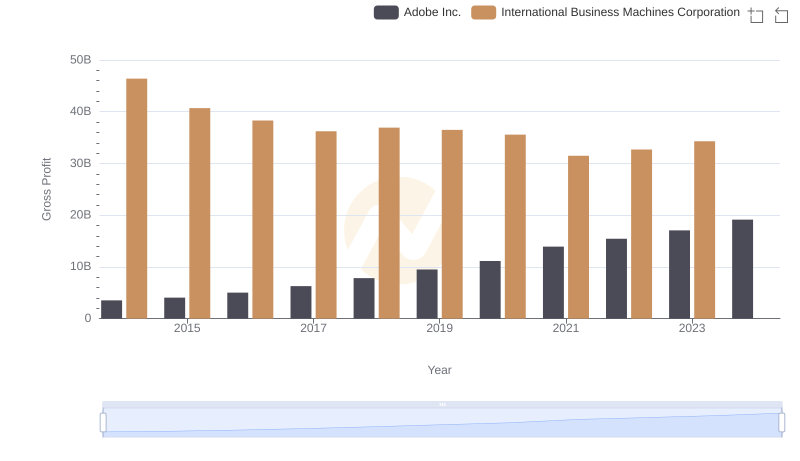
Gross Profit Trends Compared: International Business Machines Corporation vs Adobe Inc.
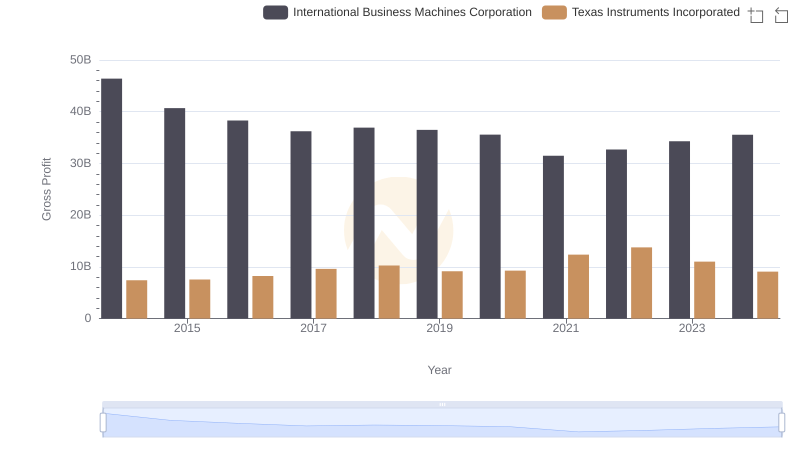
Gross Profit Comparison: International Business Machines Corporation and Texas Instruments Incorporated Trends
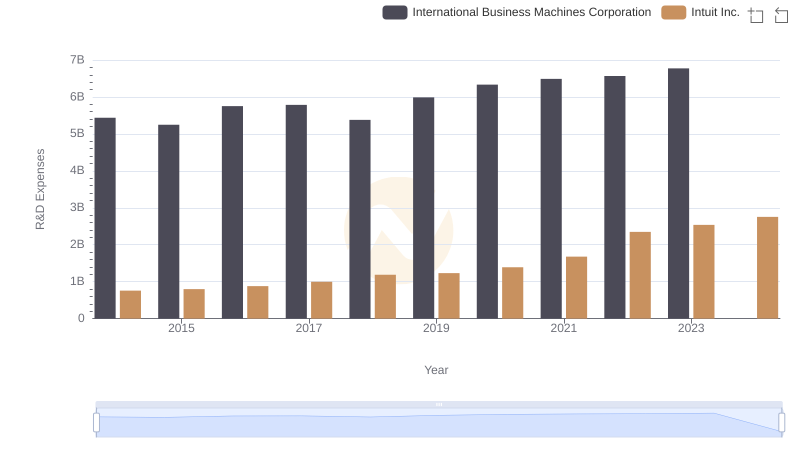
Analyzing R&D Budgets: International Business Machines Corporation vs Intuit Inc.
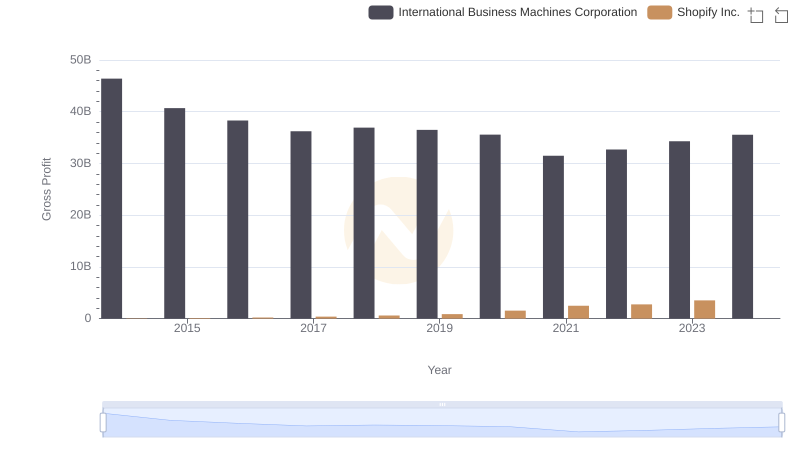
International Business Machines Corporation and Shopify Inc.: A Detailed Gross Profit Analysis
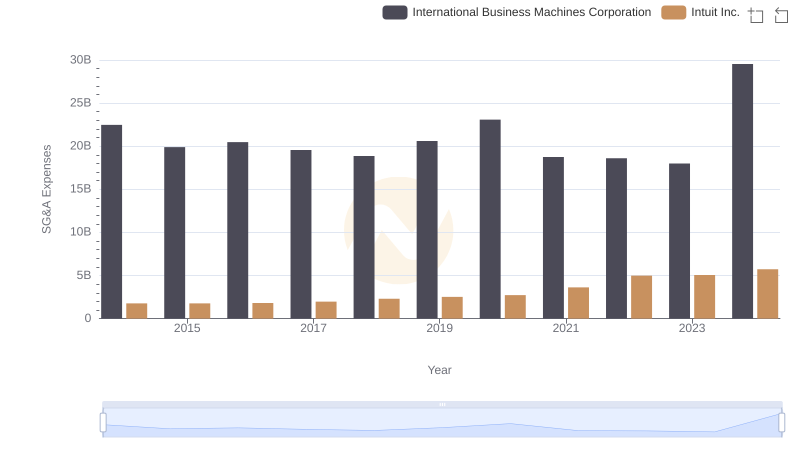
International Business Machines Corporation or Intuit Inc.: Who Manages SG&A Costs Better?
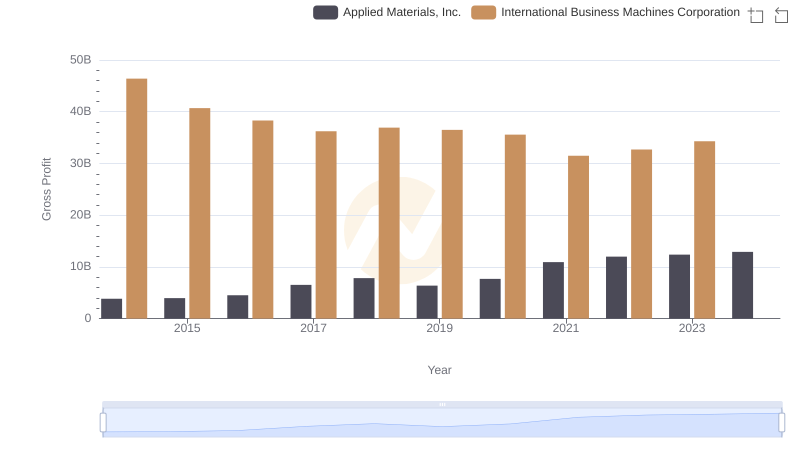
Gross Profit Analysis: Comparing International Business Machines Corporation and Applied Materials, Inc.
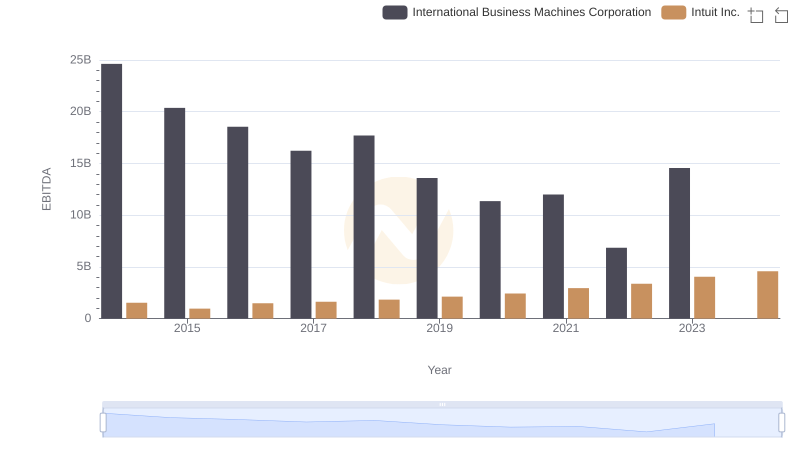
International Business Machines Corporation vs Intuit Inc.: In-Depth EBITDA Performance Comparison
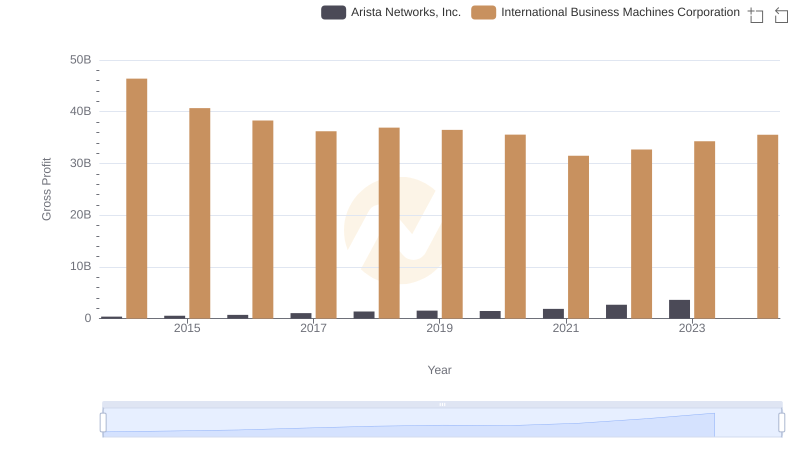
Who Generates Higher Gross Profit? International Business Machines Corporation or Arista Networks, Inc.