| __timestamp | International Business Machines Corporation | Texas Instruments Incorporated |
|---|---|---|
| Wednesday, January 1, 2014 | 46407000000 | 7427000000 |
| Thursday, January 1, 2015 | 40684000000 | 7560000000 |
| Friday, January 1, 2016 | 38516000000 | 8240000000 |
| Sunday, January 1, 2017 | 36943000000 | 9614000000 |
| Monday, January 1, 2018 | 36936000000 | 10277000000 |
| Tuesday, January 1, 2019 | 31533000000 | 9164000000 |
| Wednesday, January 1, 2020 | 30865000000 | 9269000000 |
| Friday, January 1, 2021 | 31486000000 | 12376000000 |
| Saturday, January 1, 2022 | 32687000000 | 13771000000 |
| Sunday, January 1, 2023 | 34300000000 | 11019000000 |
| Monday, January 1, 2024 | 35551000000 | 9094000000 |
Unveiling the hidden dimensions of data
In the ever-evolving landscape of technology, the financial performance of industry giants like International Business Machines Corporation (IBM) and Texas Instruments Incorporated (TXN) offers a fascinating glimpse into their strategic maneuvers. From 2014 to 2024, IBM's gross profit has seen a decline of approximately 23%, starting at a peak in 2014 and reaching its lowest in 2021. Meanwhile, Texas Instruments has demonstrated a more resilient trajectory, with a notable 48% increase in gross profit from 2014 to 2022, before a slight dip in 2023.
This comparison highlights IBM's challenges in maintaining its historical dominance, while Texas Instruments capitalizes on its strengths in semiconductor manufacturing. As we look towards 2024, the data suggests a potential stabilization for IBM and a cautious optimism for Texas Instruments. These trends underscore the dynamic nature of the tech industry and the importance of strategic adaptation.
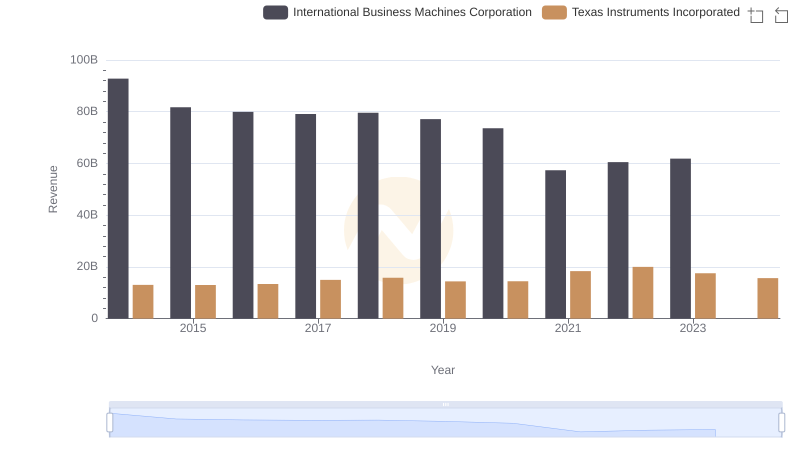
Annual Revenue Comparison: International Business Machines Corporation vs Texas Instruments Incorporated
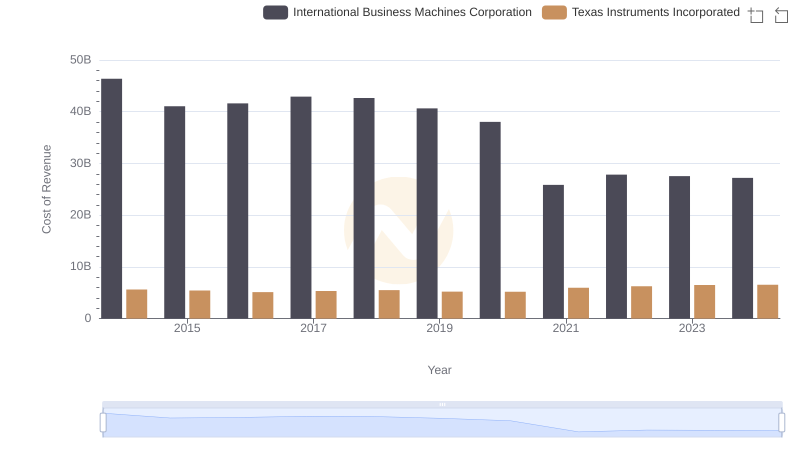
Cost Insights: Breaking Down International Business Machines Corporation and Texas Instruments Incorporated's Expenses
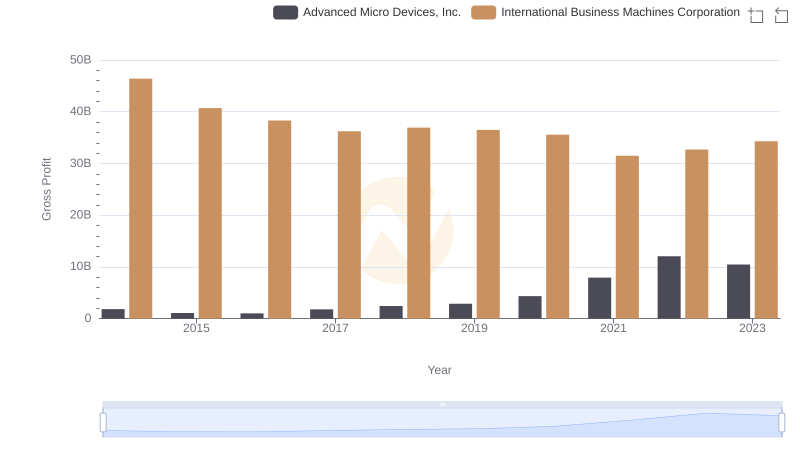
Key Insights on Gross Profit: International Business Machines Corporation vs Advanced Micro Devices, Inc.
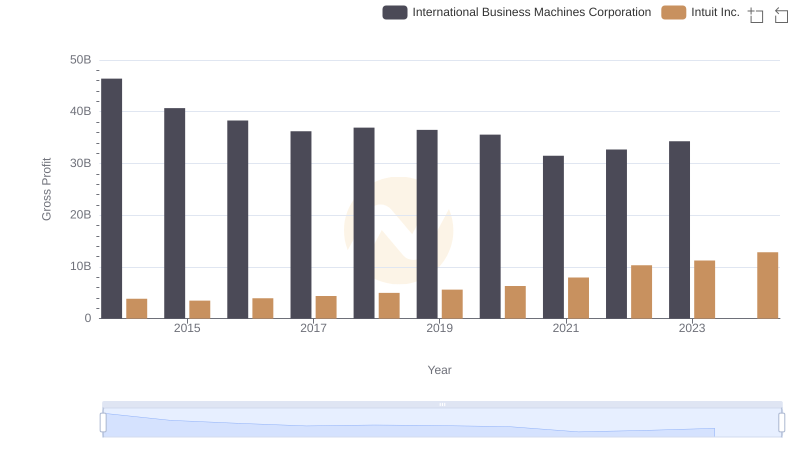
Gross Profit Comparison: International Business Machines Corporation and Intuit Inc. Trends
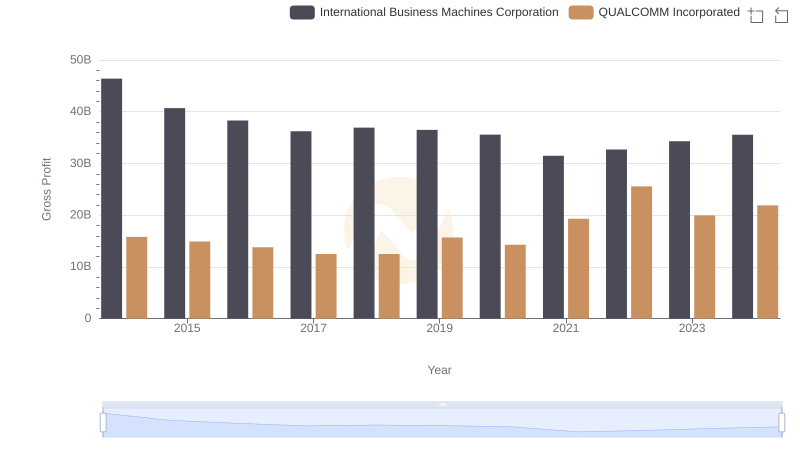
Gross Profit Trends Compared: International Business Machines Corporation vs QUALCOMM Incorporated
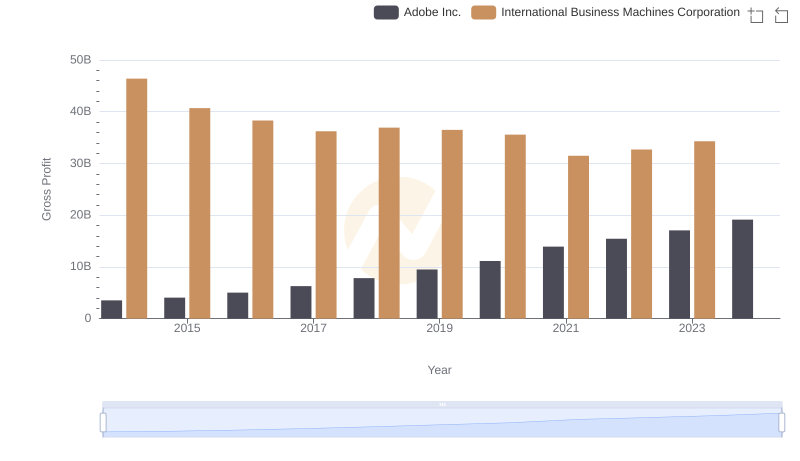
Gross Profit Trends Compared: International Business Machines Corporation vs Adobe Inc.
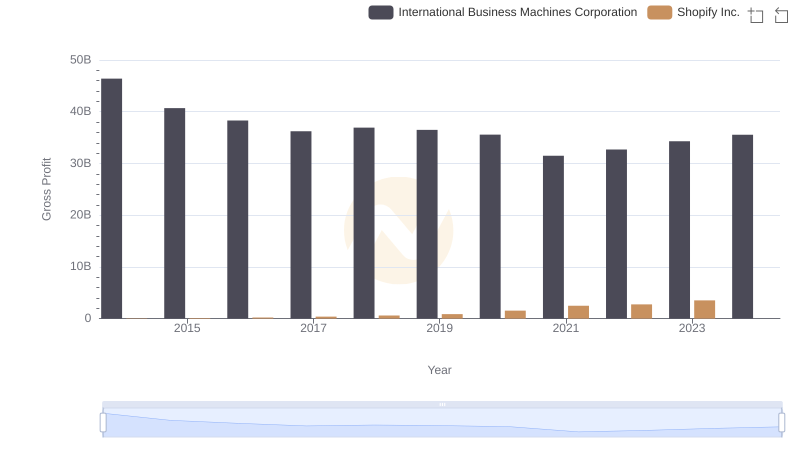
International Business Machines Corporation and Shopify Inc.: A Detailed Gross Profit Analysis
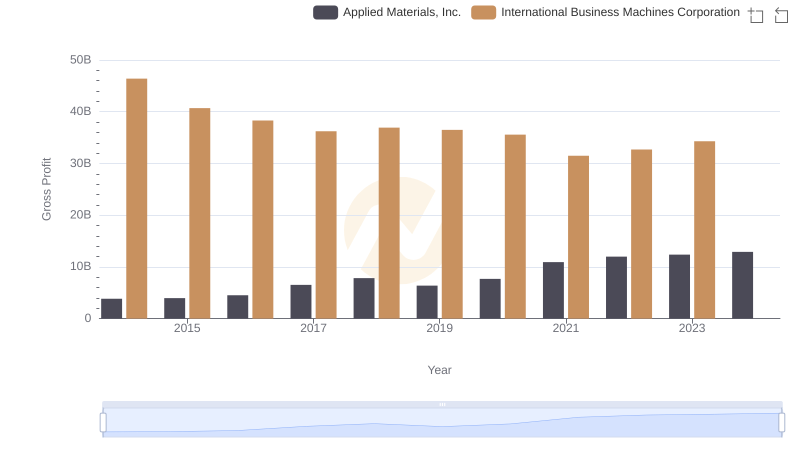
Gross Profit Analysis: Comparing International Business Machines Corporation and Applied Materials, Inc.
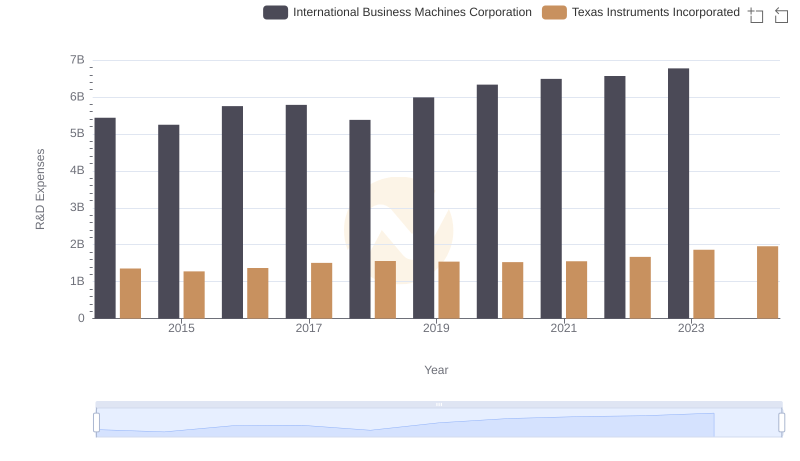
R&D Spending Showdown: International Business Machines Corporation vs Texas Instruments Incorporated
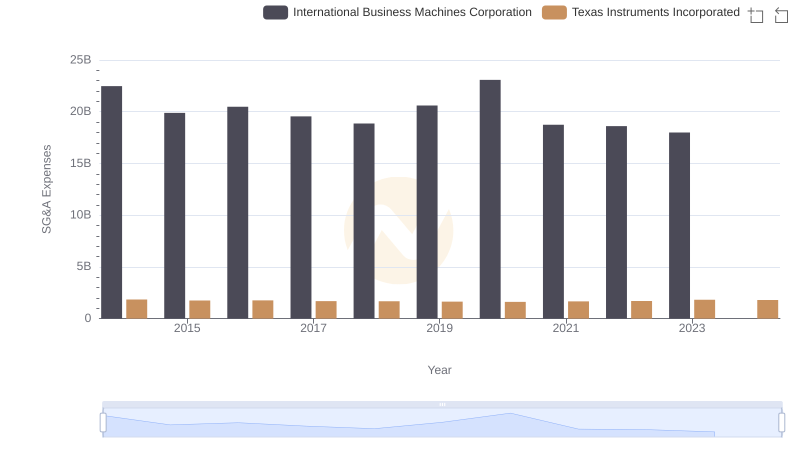
International Business Machines Corporation or Texas Instruments Incorporated: Who Manages SG&A Costs Better?
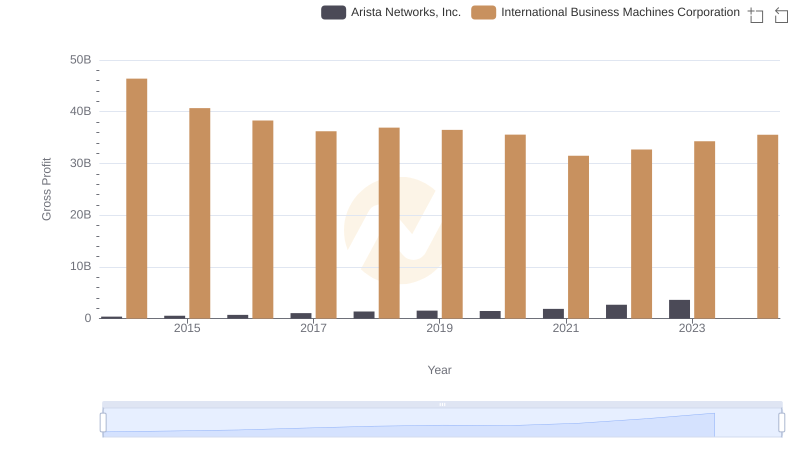
Who Generates Higher Gross Profit? International Business Machines Corporation or Arista Networks, Inc.
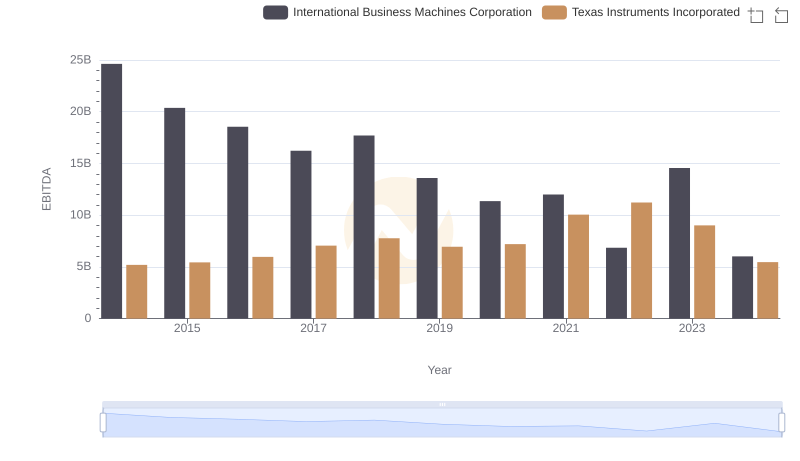
EBITDA Performance Review: International Business Machines Corporation vs Texas Instruments Incorporated