| __timestamp | Arista Networks, Inc. | International Business Machines Corporation |
|---|---|---|
| Wednesday, January 1, 2014 | 392091000 | 46407000000 |
| Thursday, January 1, 2015 | 543560000 | 40684000000 |
| Friday, January 1, 2016 | 723116000 | 38516000000 |
| Sunday, January 1, 2017 | 1061769000 | 36943000000 |
| Monday, January 1, 2018 | 1373377000 | 36936000000 |
| Tuesday, January 1, 2019 | 1544338000 | 31533000000 |
| Wednesday, January 1, 2020 | 1481886000 | 30865000000 |
| Friday, January 1, 2021 | 1880779000 | 31486000000 |
| Saturday, January 1, 2022 | 2675696000 | 32687000000 |
| Sunday, January 1, 2023 | 3630281000 | 34300000000 |
| Monday, January 1, 2024 | 4491303000 | 35551000000 |
Igniting the spark of knowledge
In the ever-evolving tech landscape, the battle for supremacy in gross profit generation is fierce. From 2014 to 2023, International Business Machines Corporation (IBM) consistently outperformed Arista Networks, Inc. in terms of gross profit. IBM's gross profit peaked in 2014, reaching nearly 46.4 billion, while Arista Networks started at a modest 392 million. Over the years, IBM maintained a robust average gross profit of approximately 36.8 billion, despite a slight decline. Meanwhile, Arista Networks demonstrated impressive growth, with its gross profit increasing by over 800% to 3.63 billion by 2023. This growth trajectory highlights Arista's rapid expansion in the tech industry. However, IBM's dominance remains unchallenged, with its gross profit consistently surpassing Arista's by a significant margin. As we look to the future, the question remains: Can Arista Networks continue its upward trend and close the gap with IBM?
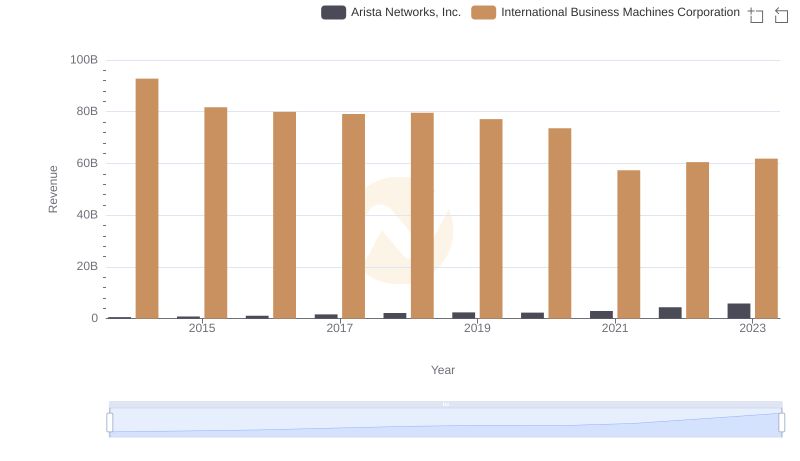
Annual Revenue Comparison: International Business Machines Corporation vs Arista Networks, Inc.
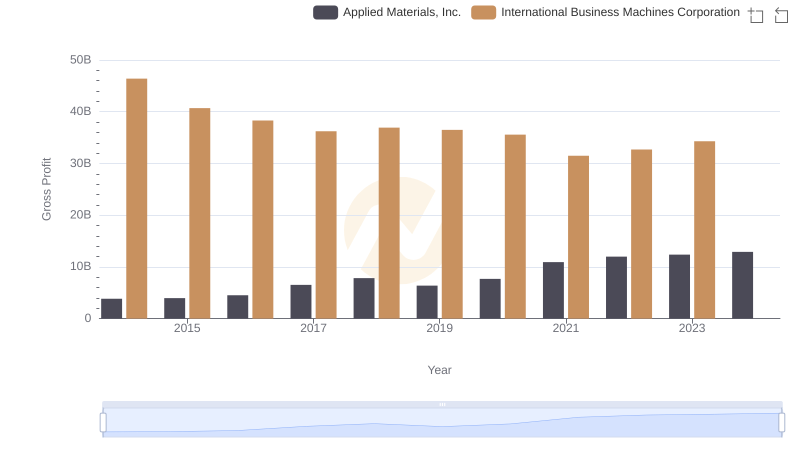
Gross Profit Analysis: Comparing International Business Machines Corporation and Applied Materials, Inc.
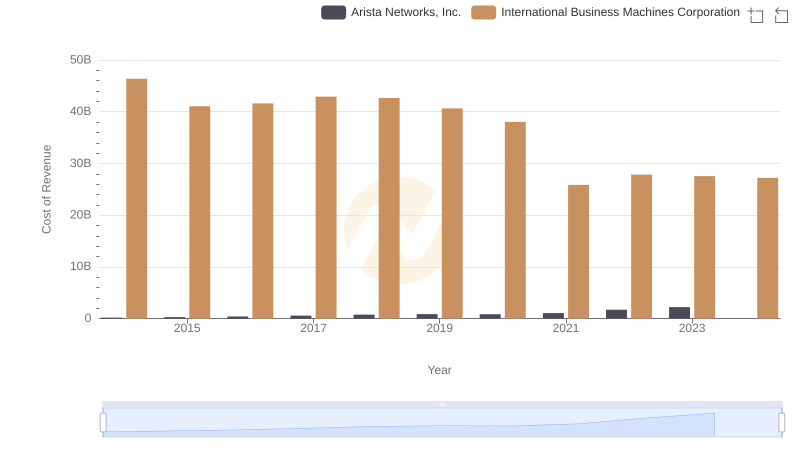
Analyzing Cost of Revenue: International Business Machines Corporation and Arista Networks, Inc.
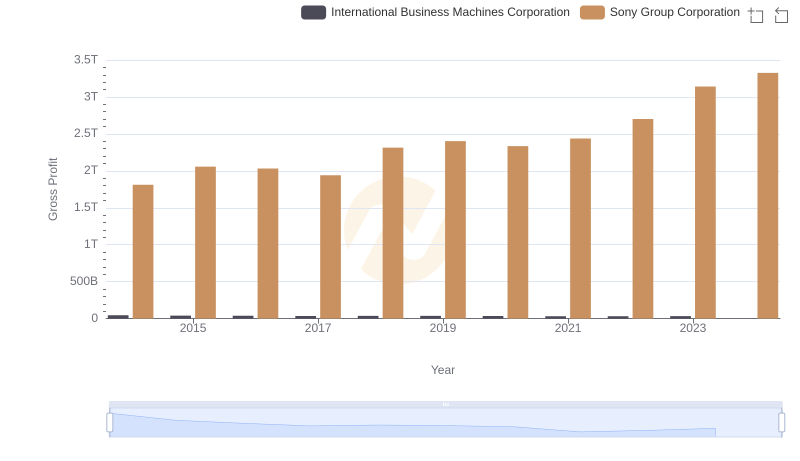
Who Generates Higher Gross Profit? International Business Machines Corporation or Sony Group Corporation
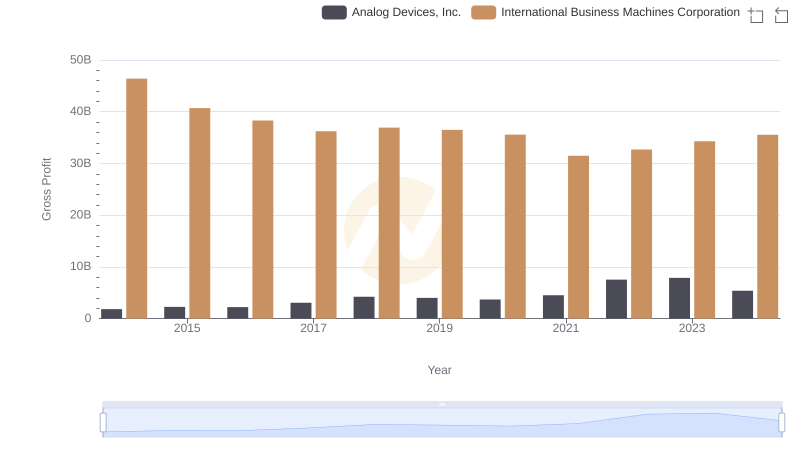
Who Generates Higher Gross Profit? International Business Machines Corporation or Analog Devices, Inc.
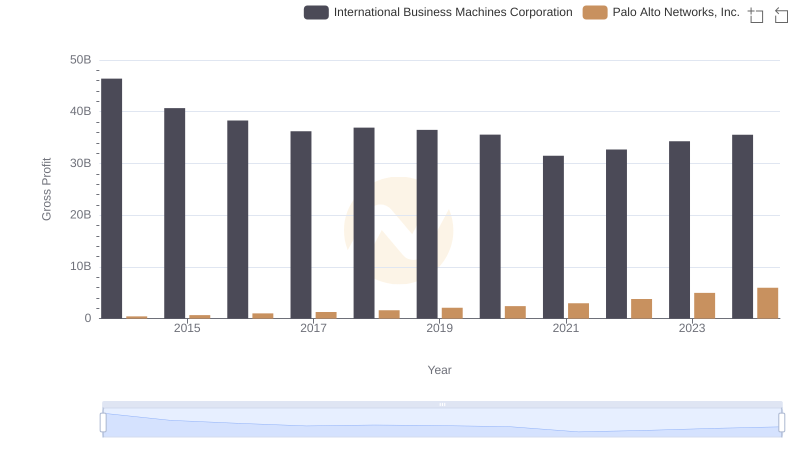
Gross Profit Trends Compared: International Business Machines Corporation vs Palo Alto Networks, Inc.
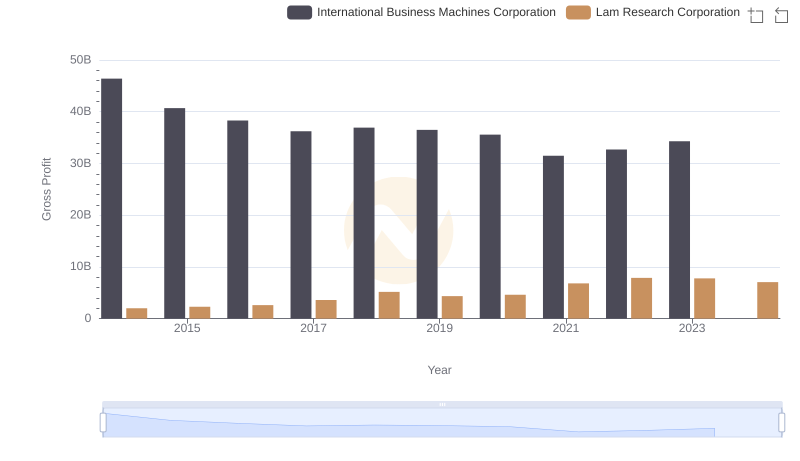
International Business Machines Corporation and Lam Research Corporation: A Detailed Gross Profit Analysis
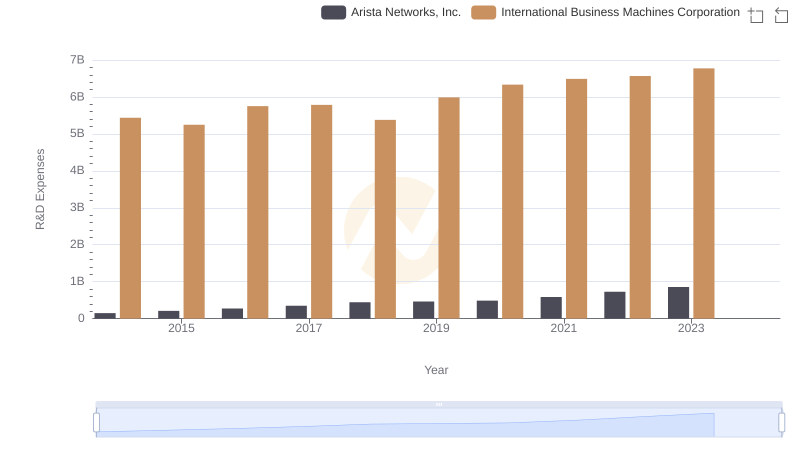
International Business Machines Corporation vs Arista Networks, Inc.: Strategic Focus on R&D Spending
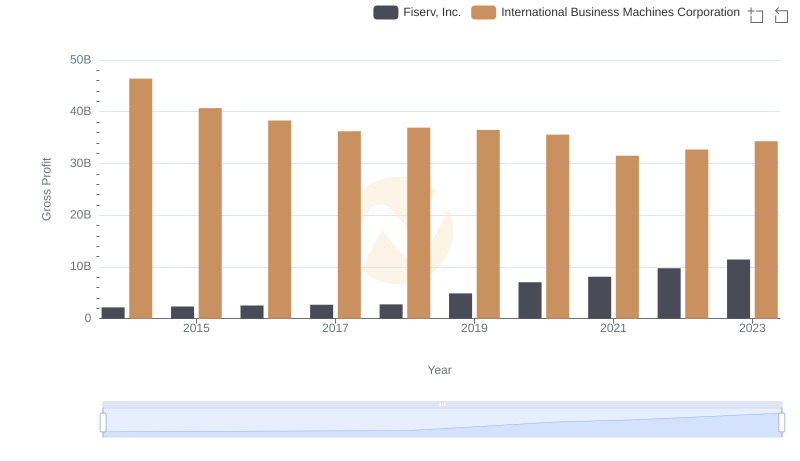
Key Insights on Gross Profit: International Business Machines Corporation vs Fiserv, Inc.
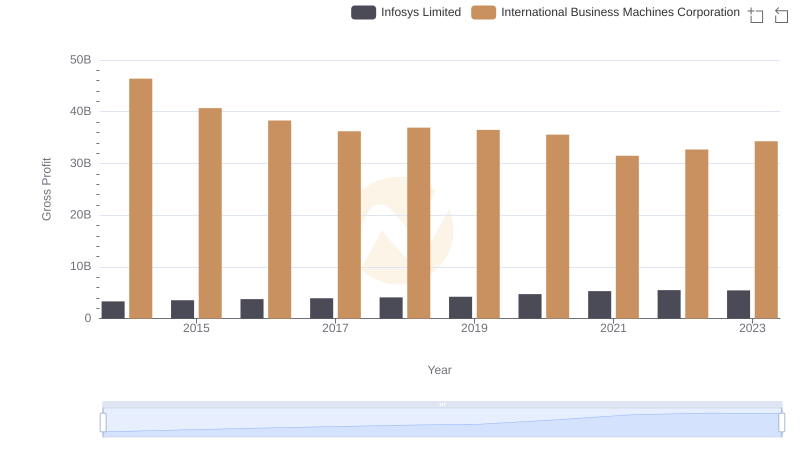
Key Insights on Gross Profit: International Business Machines Corporation vs Infosys Limited
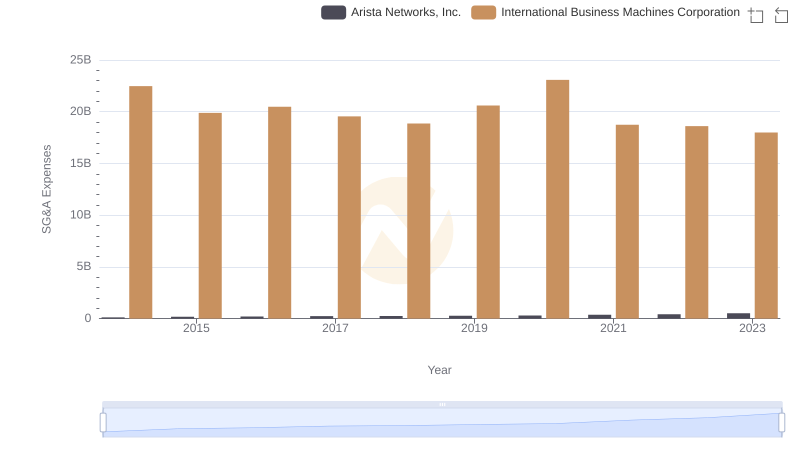
Comparing SG&A Expenses: International Business Machines Corporation vs Arista Networks, Inc. Trends and Insights
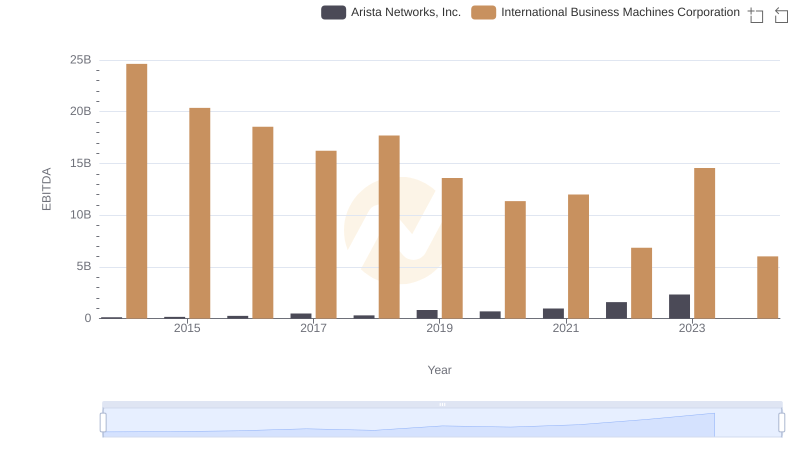
EBITDA Analysis: Evaluating International Business Machines Corporation Against Arista Networks, Inc.