| __timestamp | International Business Machines Corporation | Intuit Inc. |
|---|---|---|
| Wednesday, January 1, 2014 | 92793000000 | 4506000000 |
| Thursday, January 1, 2015 | 81742000000 | 4192000000 |
| Friday, January 1, 2016 | 79920000000 | 4694000000 |
| Sunday, January 1, 2017 | 79139000000 | 5177000000 |
| Monday, January 1, 2018 | 79591000000 | 5964000000 |
| Tuesday, January 1, 2019 | 57714000000 | 6784000000 |
| Wednesday, January 1, 2020 | 55179000000 | 7679000000 |
| Friday, January 1, 2021 | 57351000000 | 9633000000 |
| Saturday, January 1, 2022 | 60530000000 | 12726000000 |
| Sunday, January 1, 2023 | 61860000000 | 14368000000 |
| Monday, January 1, 2024 | 62753000000 | 16285000000 |
Data in motion
In the ever-evolving landscape of technology giants, the revenue trajectories of International Business Machines Corporation (IBM) and Intuit Inc. offer a fascinating glimpse into their strategic pivots over the past decade. From 2014 to 2024, IBM's revenue has seen a decline of approximately 32%, reflecting its transition from traditional hardware to cloud computing and AI services. In contrast, Intuit has experienced a remarkable growth of over 260%, driven by its focus on financial software solutions and strategic acquisitions.
This comparison not only highlights the contrasting fortunes of these two companies but also underscores the broader shifts within the tech industry.
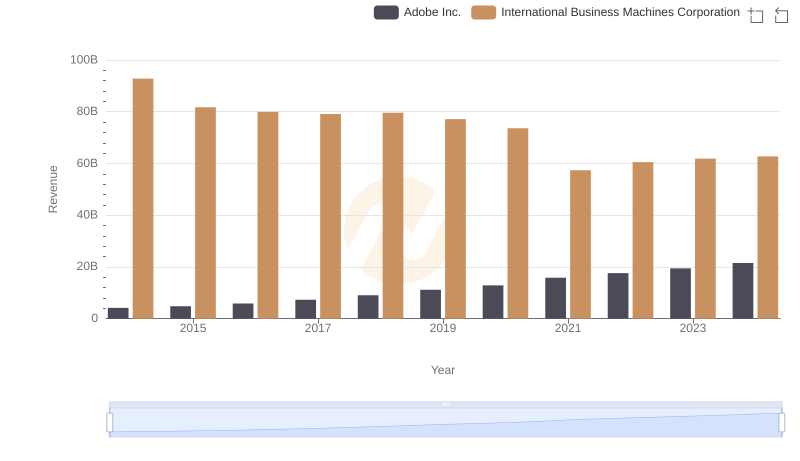
Who Generates More Revenue? International Business Machines Corporation or Adobe Inc.
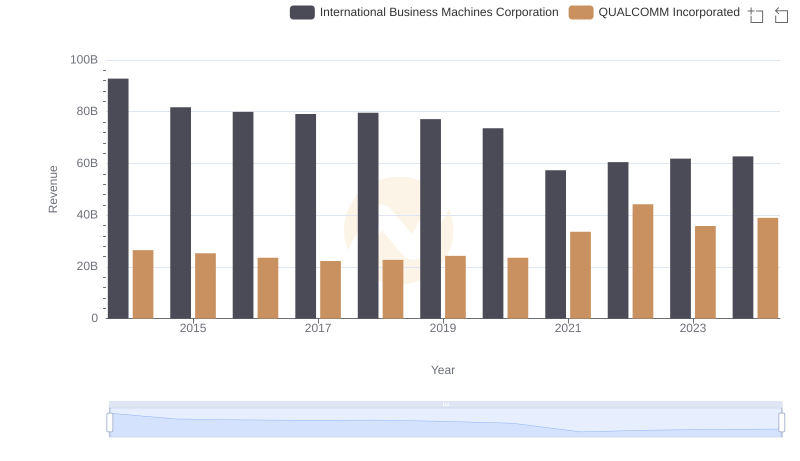
Comparing Revenue Performance: International Business Machines Corporation or QUALCOMM Incorporated?
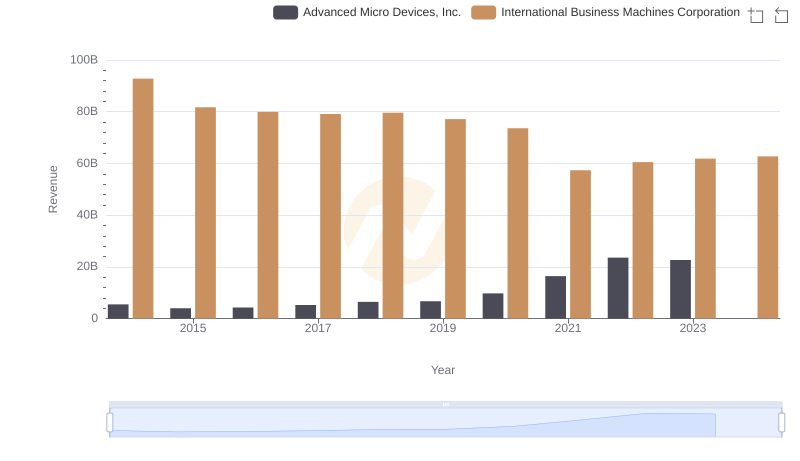
Breaking Down Revenue Trends: International Business Machines Corporation vs Advanced Micro Devices, Inc.
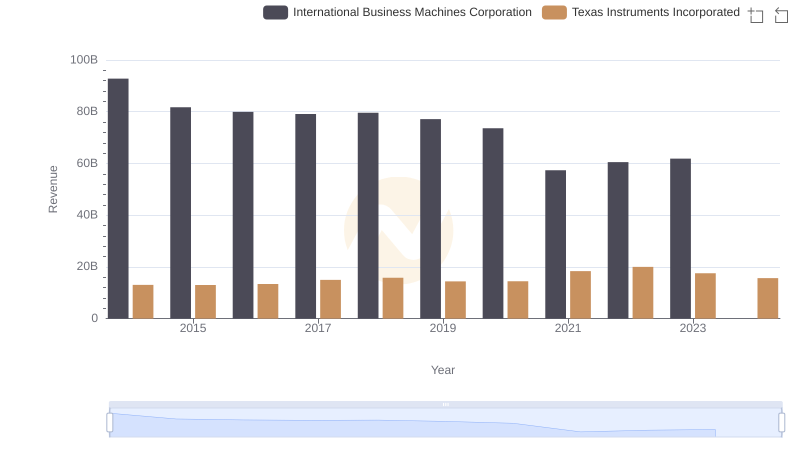
Annual Revenue Comparison: International Business Machines Corporation vs Texas Instruments Incorporated
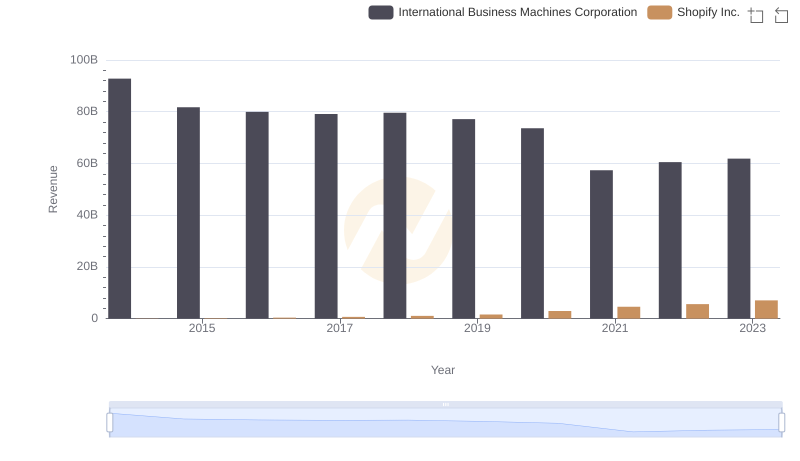
Comparing Revenue Performance: International Business Machines Corporation or Shopify Inc.?
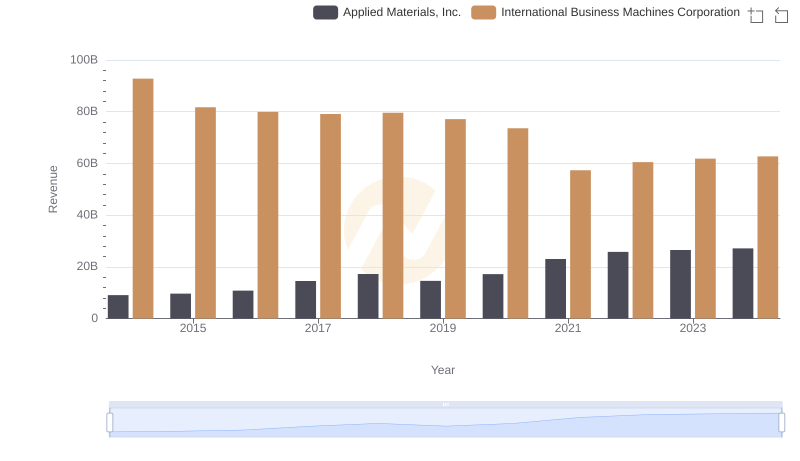
Comparing Revenue Performance: International Business Machines Corporation or Applied Materials, Inc.?
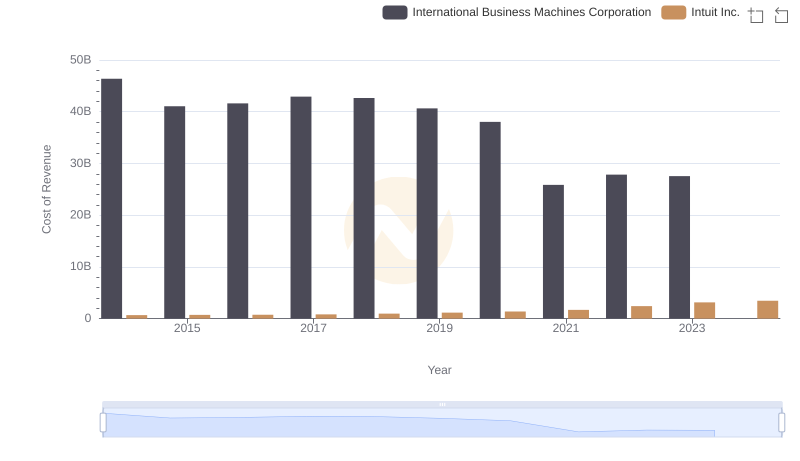
Cost of Revenue Comparison: International Business Machines Corporation vs Intuit Inc.
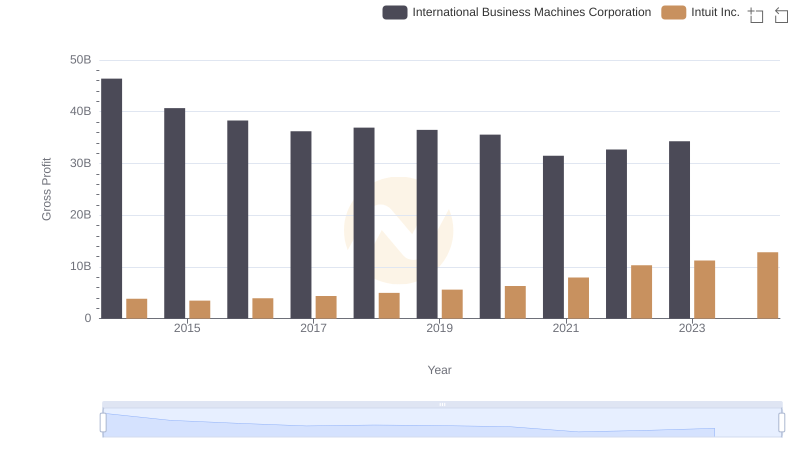
Gross Profit Comparison: International Business Machines Corporation and Intuit Inc. Trends
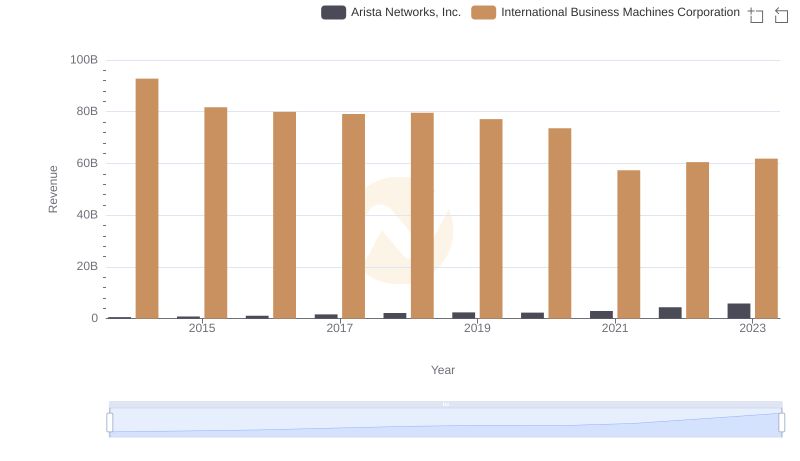
Annual Revenue Comparison: International Business Machines Corporation vs Arista Networks, Inc.
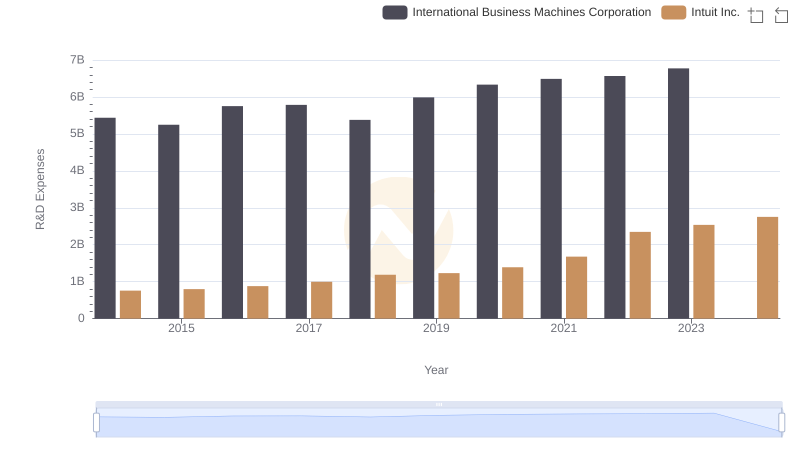
Analyzing R&D Budgets: International Business Machines Corporation vs Intuit Inc.
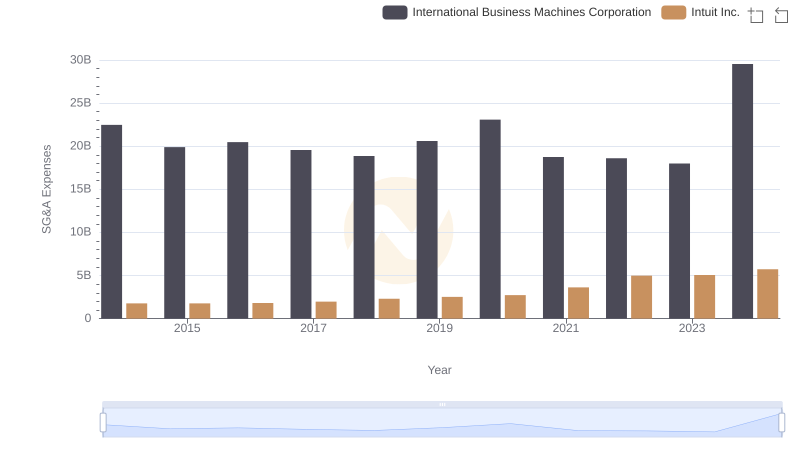
International Business Machines Corporation or Intuit Inc.: Who Manages SG&A Costs Better?
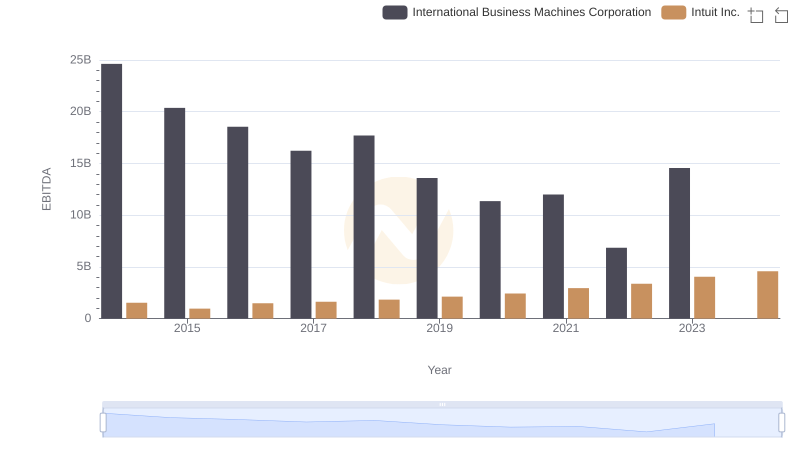
International Business Machines Corporation vs Intuit Inc.: In-Depth EBITDA Performance Comparison