| __timestamp | Advanced Micro Devices, Inc. | International Business Machines Corporation |
|---|---|---|
| Wednesday, January 1, 2014 | 1839000000 | 46407000000 |
| Thursday, January 1, 2015 | 1080000000 | 40684000000 |
| Friday, January 1, 2016 | 1003000000 | 38516000000 |
| Sunday, January 1, 2017 | 1787000000 | 36943000000 |
| Monday, January 1, 2018 | 2447000000 | 36936000000 |
| Tuesday, January 1, 2019 | 2868000000 | 31533000000 |
| Wednesday, January 1, 2020 | 4347000000 | 30865000000 |
| Friday, January 1, 2021 | 7929000000 | 31486000000 |
| Saturday, January 1, 2022 | 12051000000 | 32687000000 |
| Sunday, January 1, 2023 | 10460000000 | 34300000000 |
| Monday, January 1, 2024 | 12725000000 | 35551000000 |
Infusing magic into the data realm
In the ever-evolving landscape of technology, the financial performance of industry titans like International Business Machines Corporation (IBM) and Advanced Micro Devices, Inc. (AMD) offers a fascinating glimpse into their strategic trajectories. Over the past decade, IBM has consistently maintained a robust gross profit, averaging around $36.8 billion annually. Despite a slight decline, IBM's gross profit remains a testament to its enduring market presence.
Conversely, AMD has demonstrated a remarkable growth trajectory, with its gross profit surging by over 500% from 2014 to 2023. This growth underscores AMD's successful pivot towards high-performance computing and graphics solutions. Notably, 2022 marked a peak for AMD, with gross profits reaching approximately $12 billion, a stark contrast to its $1 billion in 2016.
While IBM's figures reflect stability, AMD's dynamic growth highlights its aggressive market strategies and innovation-driven approach.
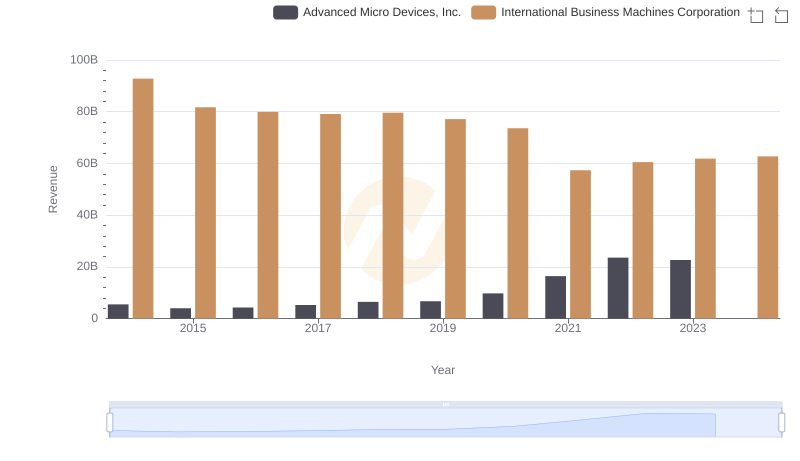
Breaking Down Revenue Trends: International Business Machines Corporation vs Advanced Micro Devices, Inc.
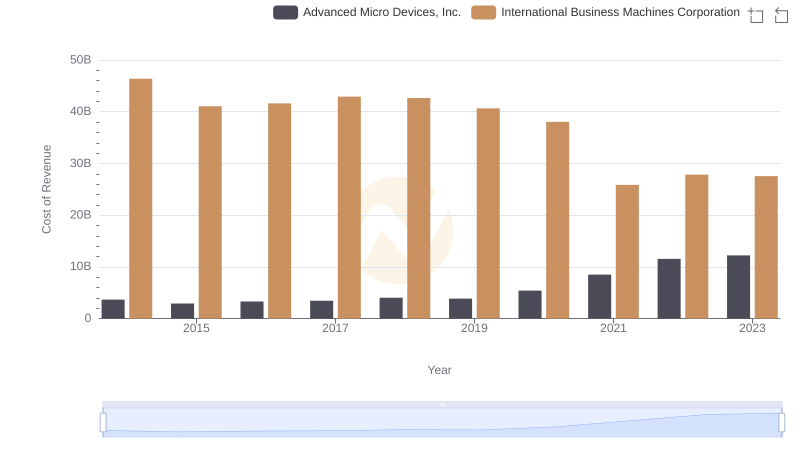
Cost of Revenue Trends: International Business Machines Corporation vs Advanced Micro Devices, Inc.
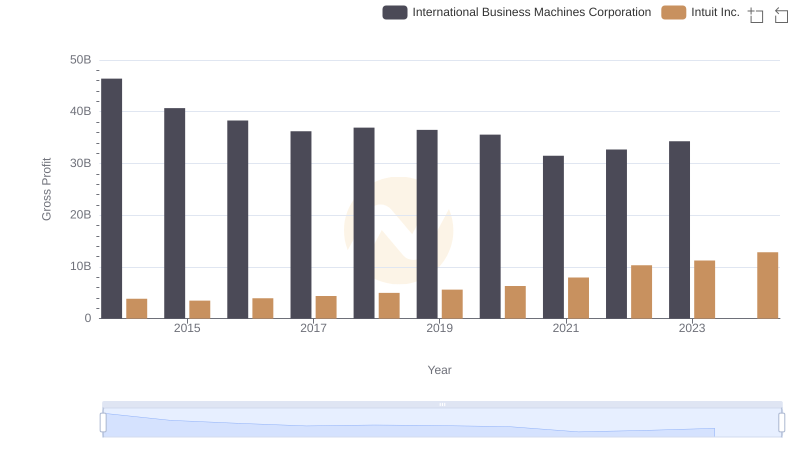
Gross Profit Comparison: International Business Machines Corporation and Intuit Inc. Trends
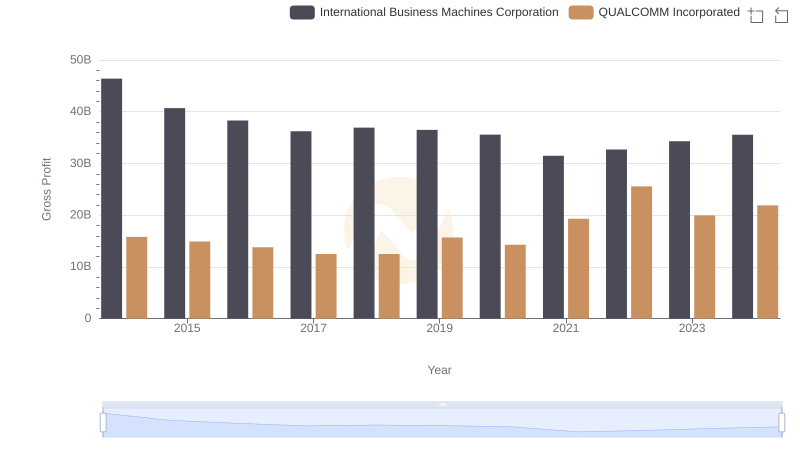
Gross Profit Trends Compared: International Business Machines Corporation vs QUALCOMM Incorporated
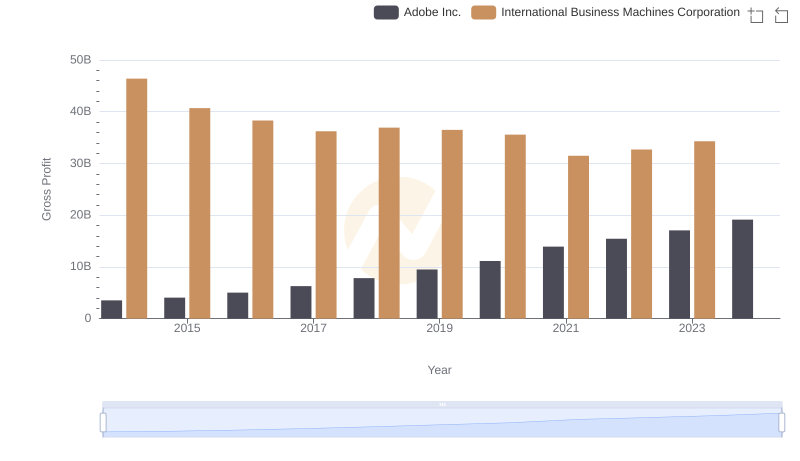
Gross Profit Trends Compared: International Business Machines Corporation vs Adobe Inc.
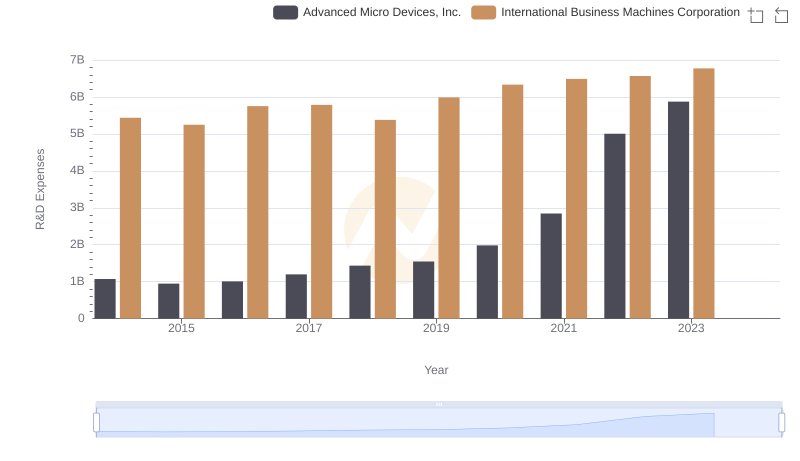
R&D Insights: How International Business Machines Corporation and Advanced Micro Devices, Inc. Allocate Funds
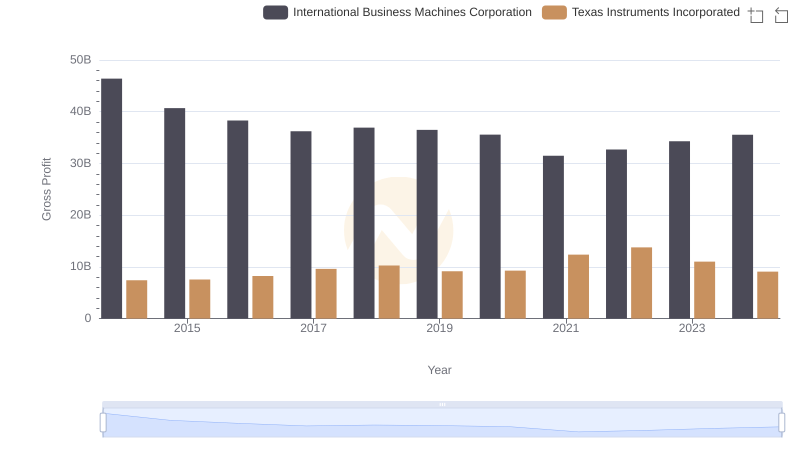
Gross Profit Comparison: International Business Machines Corporation and Texas Instruments Incorporated Trends
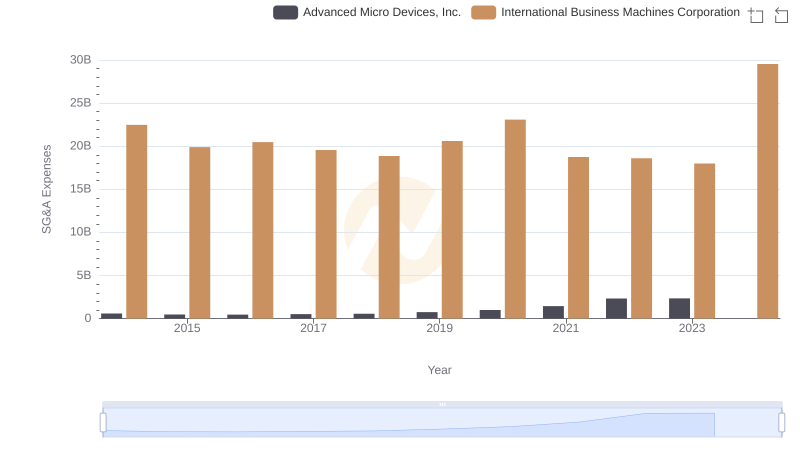
Operational Costs Compared: SG&A Analysis of International Business Machines Corporation and Advanced Micro Devices, Inc.
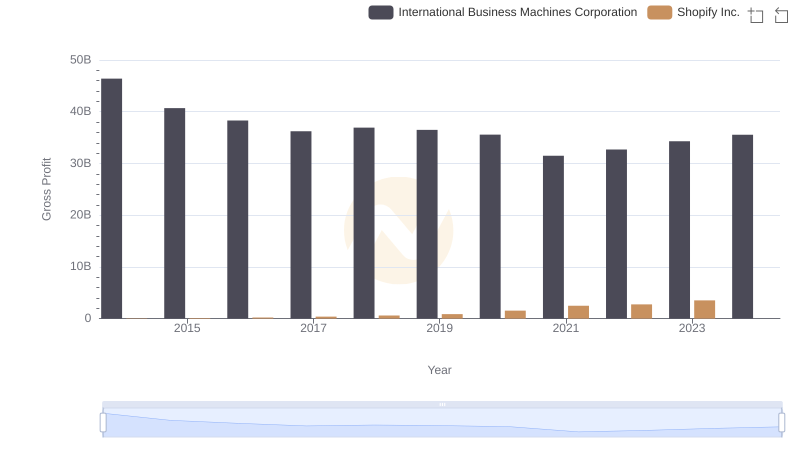
International Business Machines Corporation and Shopify Inc.: A Detailed Gross Profit Analysis
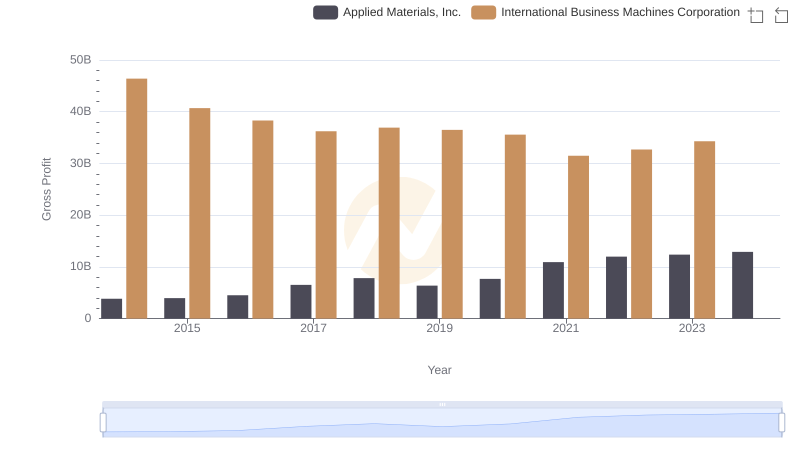
Gross Profit Analysis: Comparing International Business Machines Corporation and Applied Materials, Inc.
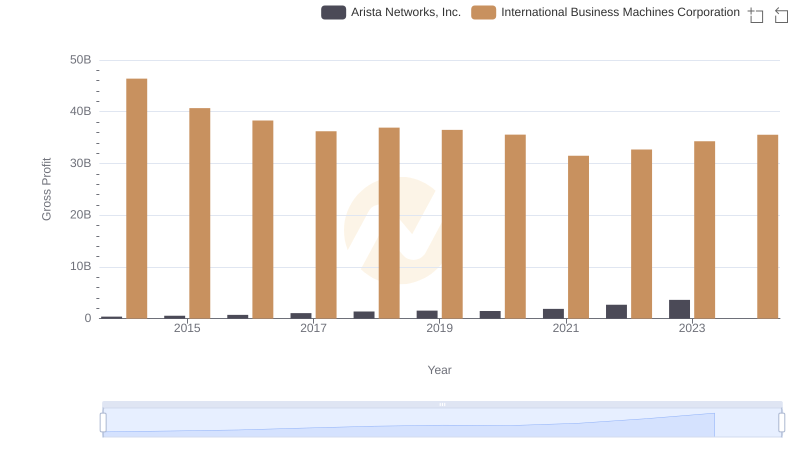
Who Generates Higher Gross Profit? International Business Machines Corporation or Arista Networks, Inc.
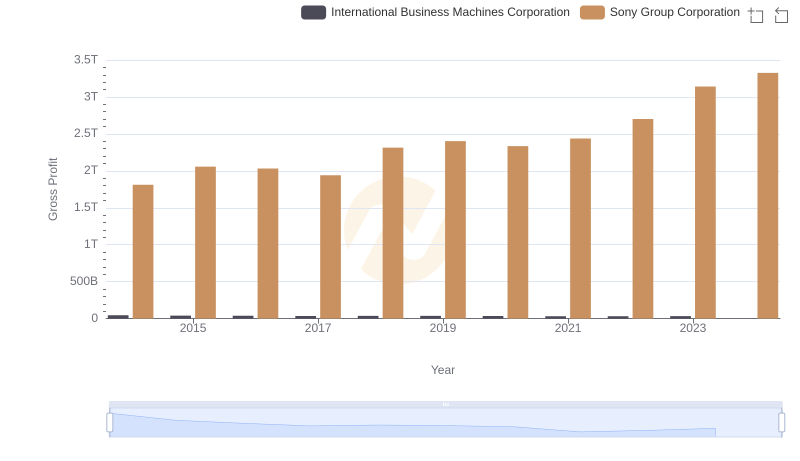
Who Generates Higher Gross Profit? International Business Machines Corporation or Sony Group Corporation