| __timestamp | International Business Machines Corporation | Intuit Inc. |
|---|---|---|
| Wednesday, January 1, 2014 | 24962000000 | 1528000000 |
| Thursday, January 1, 2015 | 20268000000 | 970000000 |
| Friday, January 1, 2016 | 17341000000 | 1480000000 |
| Sunday, January 1, 2017 | 16556000000 | 1634000000 |
| Monday, January 1, 2018 | 16545000000 | 1839000000 |
| Tuesday, January 1, 2019 | 14609000000 | 2121000000 |
| Wednesday, January 1, 2020 | 10555000000 | 2430000000 |
| Friday, January 1, 2021 | 12409000000 | 2948000000 |
| Saturday, January 1, 2022 | 7174000000 | 3369000000 |
| Sunday, January 1, 2023 | 14693000000 | 4043000000 |
| Monday, January 1, 2024 | 6015000000 | 4581000000 |
Unlocking the unknown
In the ever-evolving landscape of technology giants, the EBITDA performance of International Business Machines Corporation (IBM) and Intuit Inc. over the past decade offers a fascinating glimpse into their financial health and strategic maneuvers. From 2014 to 2024, IBM's EBITDA has seen a significant decline of approximately 76%, dropping from its peak in 2014. This trend reflects IBM's ongoing transformation and challenges in adapting to the rapidly changing tech environment.
Conversely, Intuit Inc. has demonstrated robust growth, with its EBITDA increasing nearly threefold over the same period. This growth underscores Intuit's successful expansion in the financial software sector, capitalizing on the increasing demand for digital financial solutions.
The contrasting trajectories of these two companies highlight the dynamic nature of the tech industry, where adaptability and innovation are key to sustaining growth and profitability.
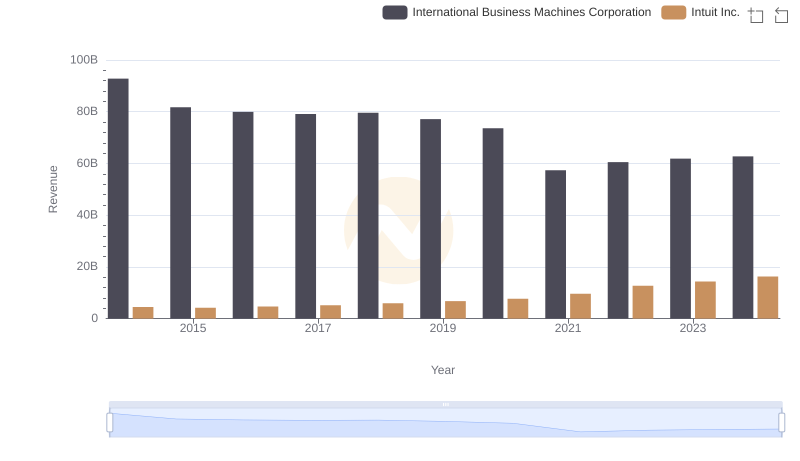
Annual Revenue Comparison: International Business Machines Corporation vs Intuit Inc.
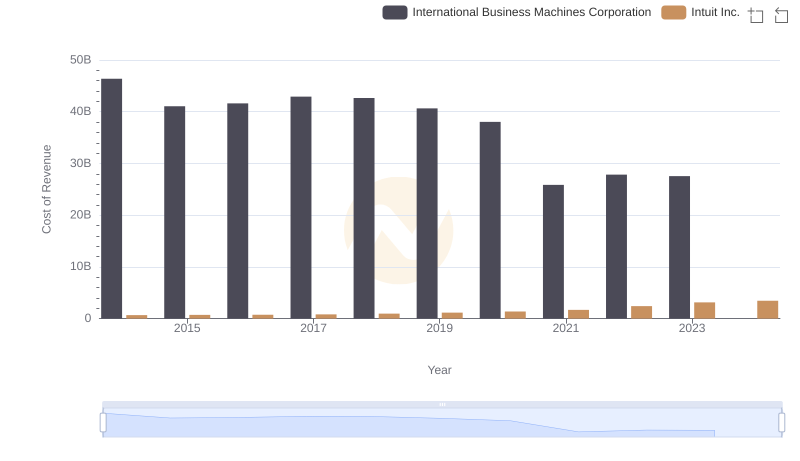
Cost of Revenue Comparison: International Business Machines Corporation vs Intuit Inc.
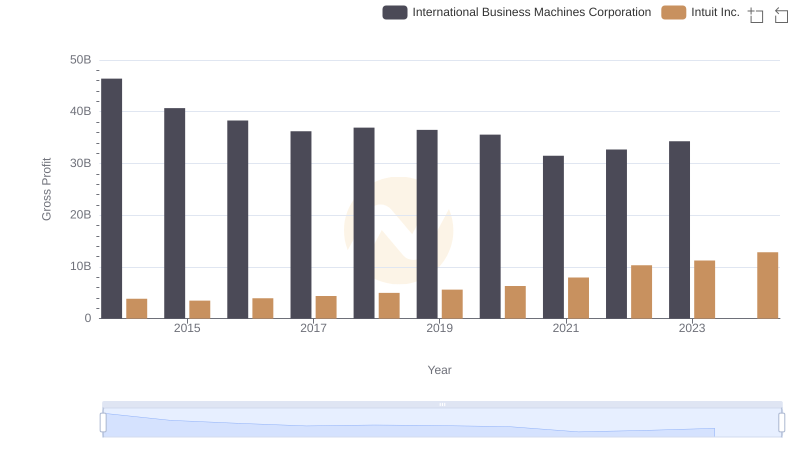
Gross Profit Comparison: International Business Machines Corporation and Intuit Inc. Trends
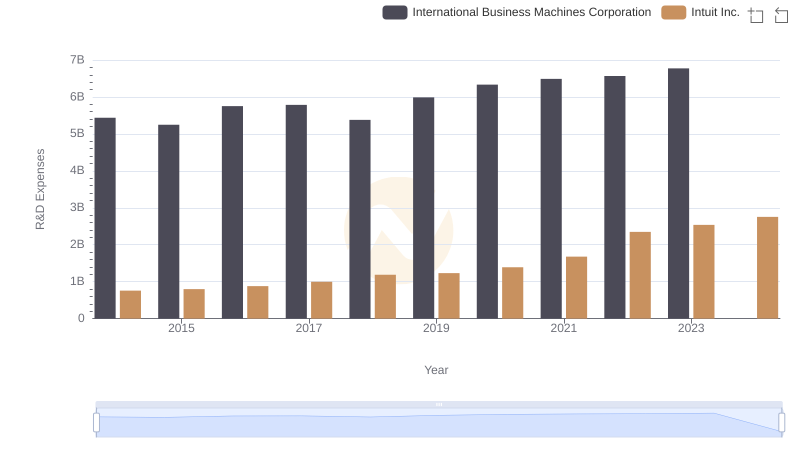
Analyzing R&D Budgets: International Business Machines Corporation vs Intuit Inc.
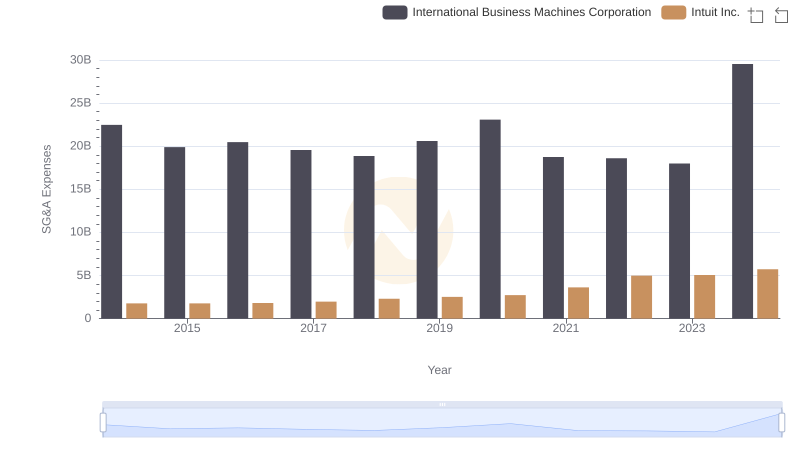
International Business Machines Corporation or Intuit Inc.: Who Manages SG&A Costs Better?
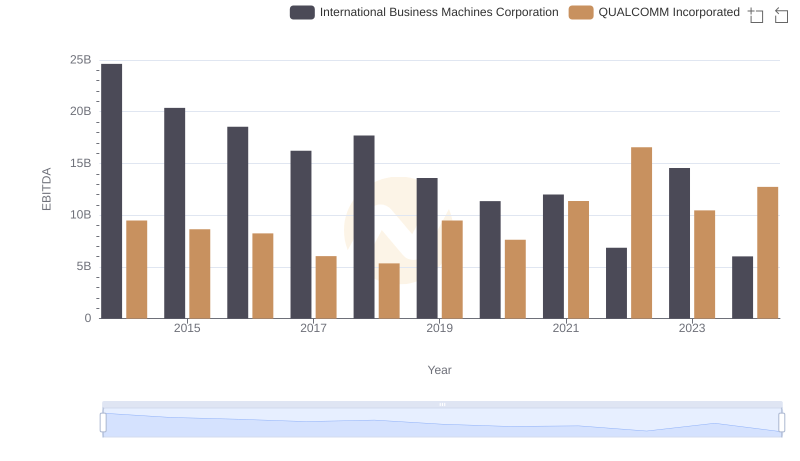
Professional EBITDA Benchmarking: International Business Machines Corporation vs QUALCOMM Incorporated
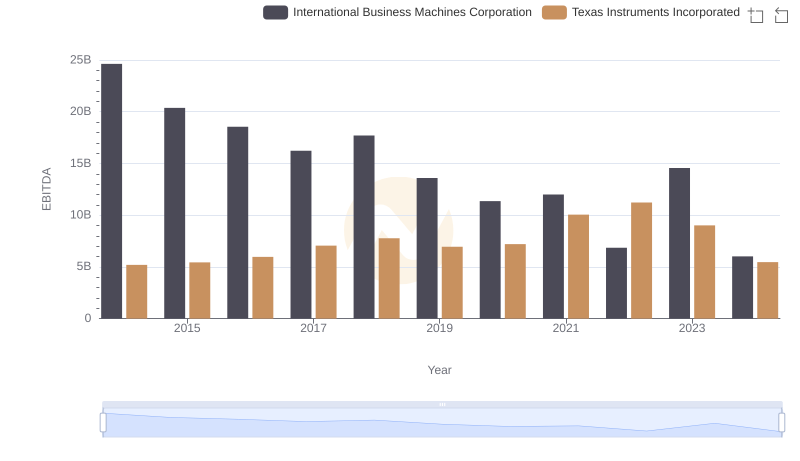
EBITDA Performance Review: International Business Machines Corporation vs Texas Instruments Incorporated
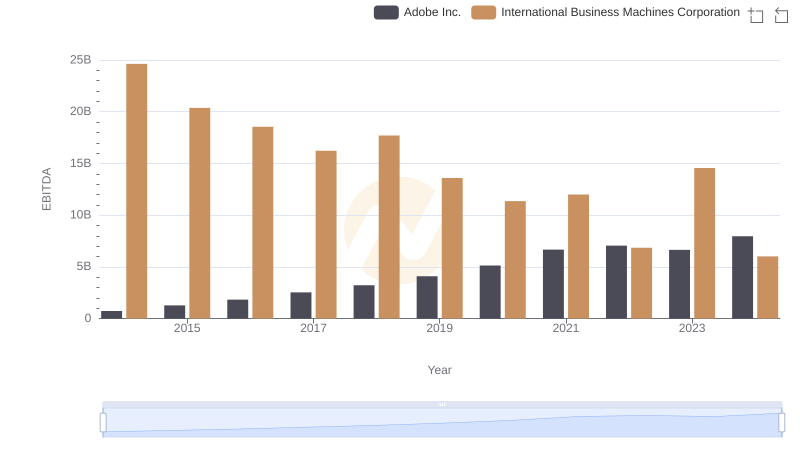
International Business Machines Corporation and Adobe Inc.: A Detailed Examination of EBITDA Performance
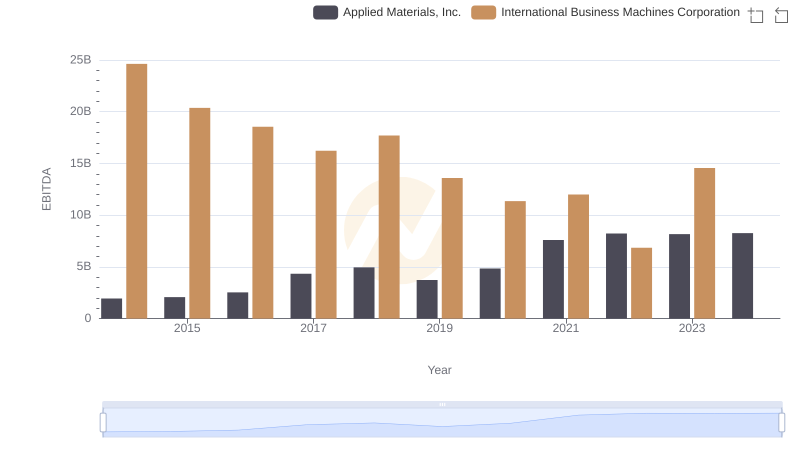
EBITDA Performance Review: International Business Machines Corporation vs Applied Materials, Inc.
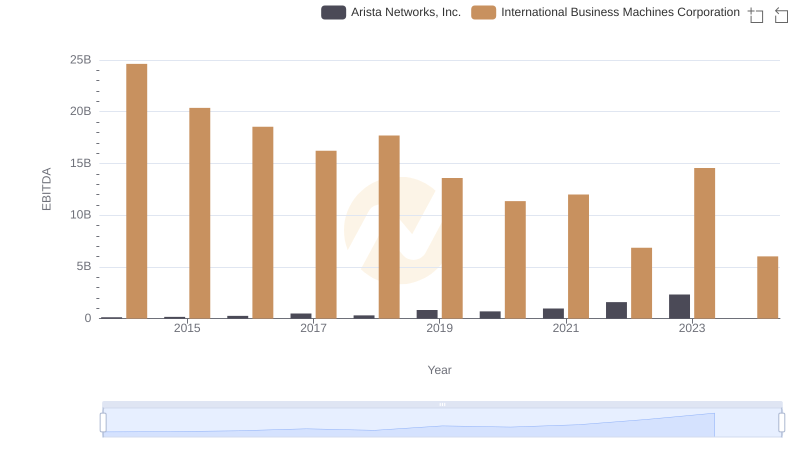
EBITDA Analysis: Evaluating International Business Machines Corporation Against Arista Networks, Inc.
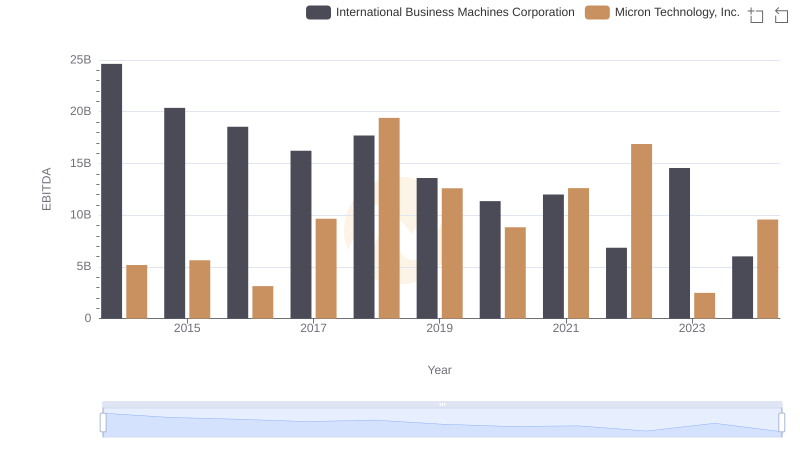
International Business Machines Corporation and Micron Technology, Inc.: A Detailed Examination of EBITDA Performance