| __timestamp | Adobe Inc. | International Business Machines Corporation |
|---|---|---|
| Wednesday, January 1, 2014 | 3524985000 | 46407000000 |
| Thursday, January 1, 2015 | 4051194000 | 40684000000 |
| Friday, January 1, 2016 | 5034522000 | 38516000000 |
| Sunday, January 1, 2017 | 6291014000 | 36943000000 |
| Monday, January 1, 2018 | 7835009000 | 36936000000 |
| Tuesday, January 1, 2019 | 9498577000 | 31533000000 |
| Wednesday, January 1, 2020 | 11146000000 | 30865000000 |
| Friday, January 1, 2021 | 13920000000 | 31486000000 |
| Saturday, January 1, 2022 | 15441000000 | 32687000000 |
| Sunday, January 1, 2023 | 17055000000 | 34300000000 |
| Monday, January 1, 2024 | 19147000000 | 35551000000 |
Igniting the spark of knowledge
In the ever-evolving landscape of technology giants, the gross profit trends of International Business Machines Corporation (IBM) and Adobe Inc. offer a fascinating glimpse into their financial trajectories over the past decade. From 2014 to 2024, Adobe's gross profit surged by an impressive 443%, reflecting its strategic pivot towards cloud-based solutions and digital media. In contrast, IBM's gross profit experienced a more modest decline of approximately 23%, highlighting the challenges faced by traditional tech companies in adapting to new market demands.
Adobe's growth trajectory is particularly noteworthy, with its gross profit increasing steadily each year, reaching a peak in 2024. Meanwhile, IBM's figures reveal a gradual decline, with a slight recovery in recent years. This comparison underscores the dynamic nature of the tech industry, where innovation and adaptability are key to sustained financial success.
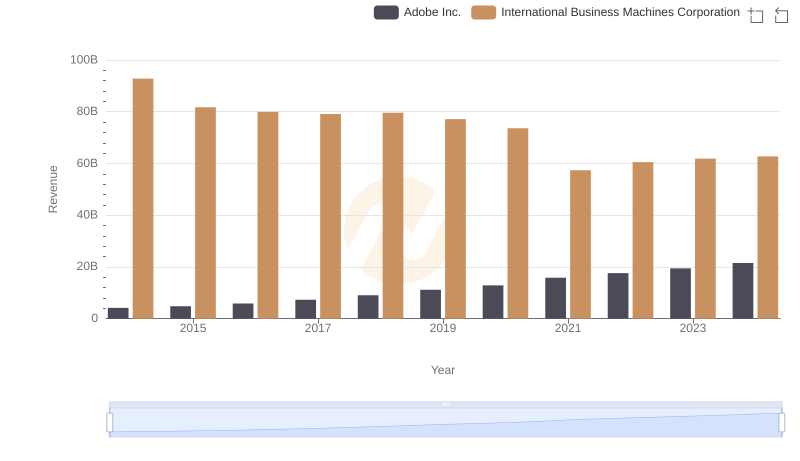
Who Generates More Revenue? International Business Machines Corporation or Adobe Inc.
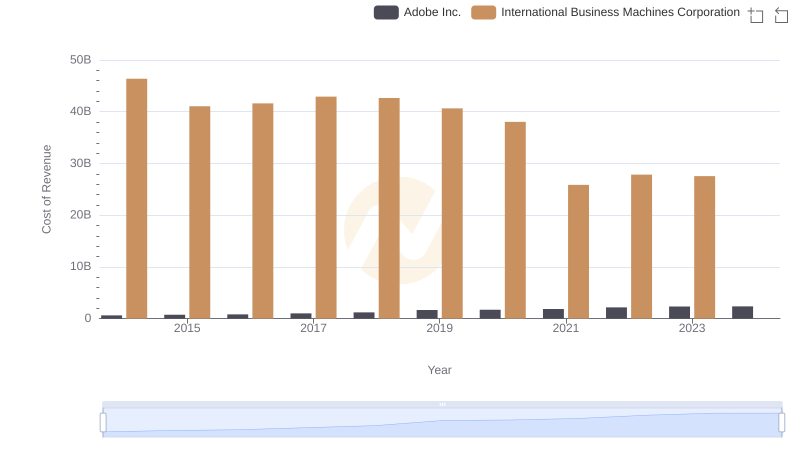
Cost of Revenue Trends: International Business Machines Corporation vs Adobe Inc.
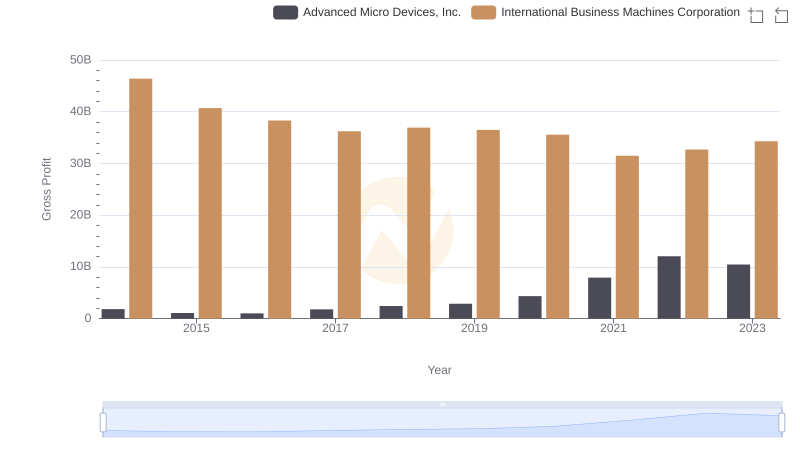
Key Insights on Gross Profit: International Business Machines Corporation vs Advanced Micro Devices, Inc.
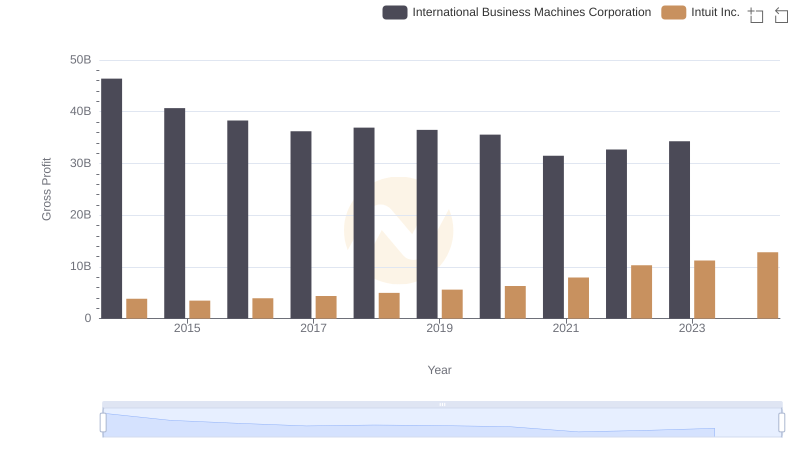
Gross Profit Comparison: International Business Machines Corporation and Intuit Inc. Trends
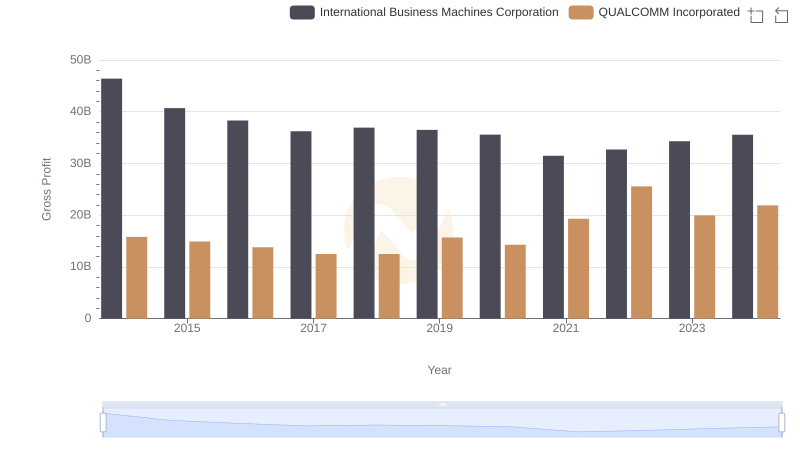
Gross Profit Trends Compared: International Business Machines Corporation vs QUALCOMM Incorporated
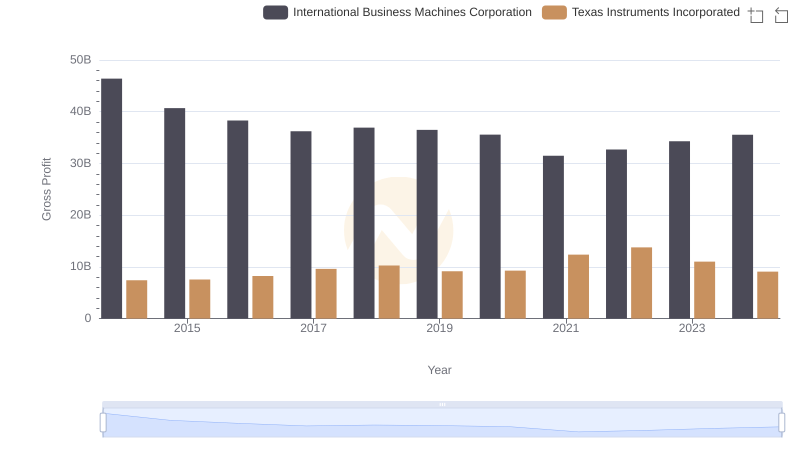
Gross Profit Comparison: International Business Machines Corporation and Texas Instruments Incorporated Trends
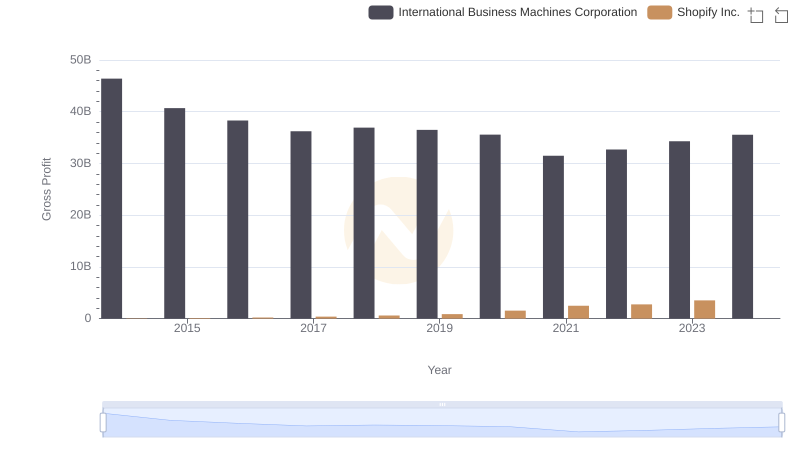
International Business Machines Corporation and Shopify Inc.: A Detailed Gross Profit Analysis
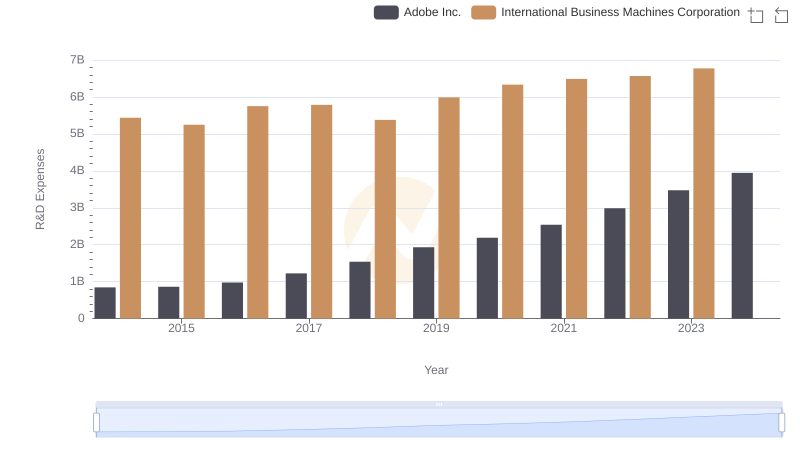
Analyzing R&D Budgets: International Business Machines Corporation vs Adobe Inc.
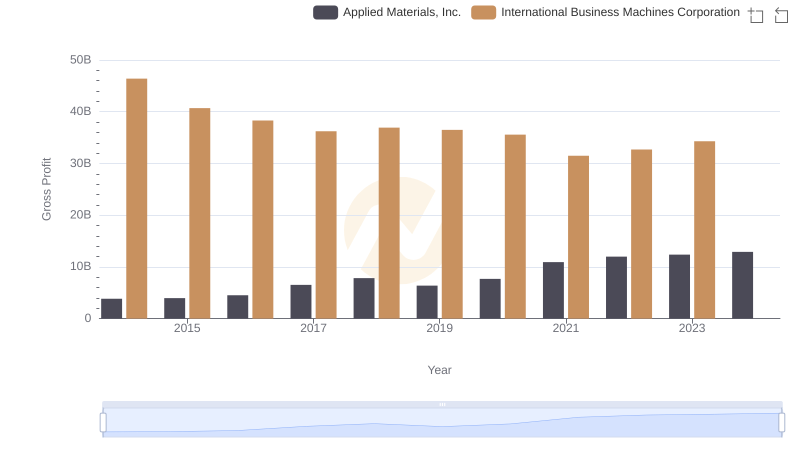
Gross Profit Analysis: Comparing International Business Machines Corporation and Applied Materials, Inc.
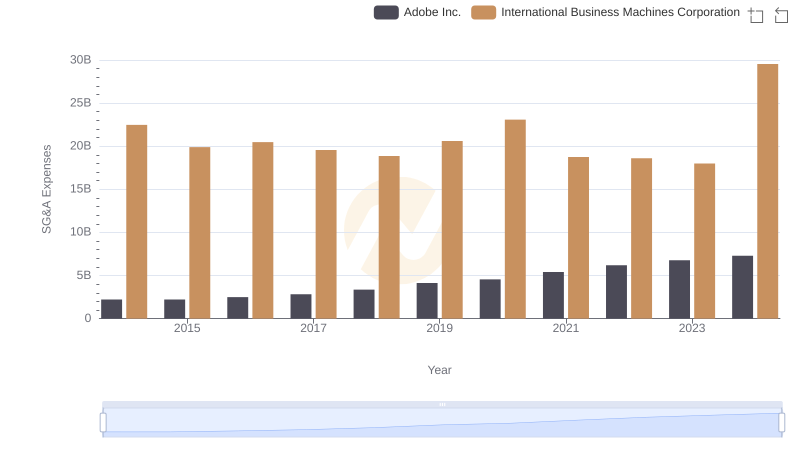
Comparing SG&A Expenses: International Business Machines Corporation vs Adobe Inc. Trends and Insights
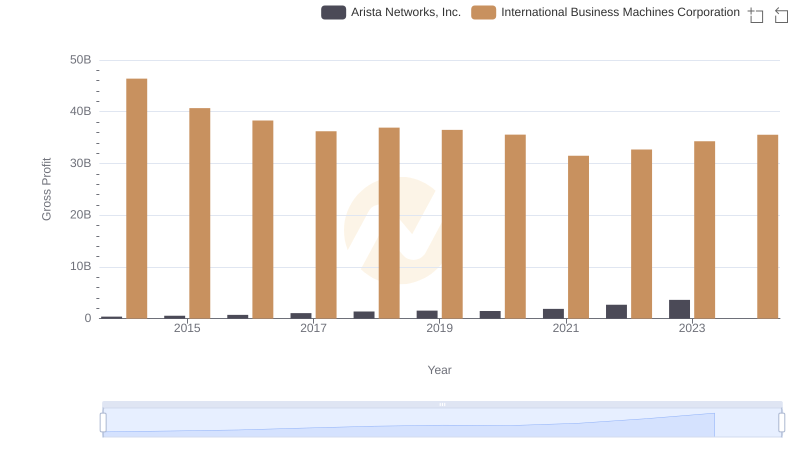
Who Generates Higher Gross Profit? International Business Machines Corporation or Arista Networks, Inc.
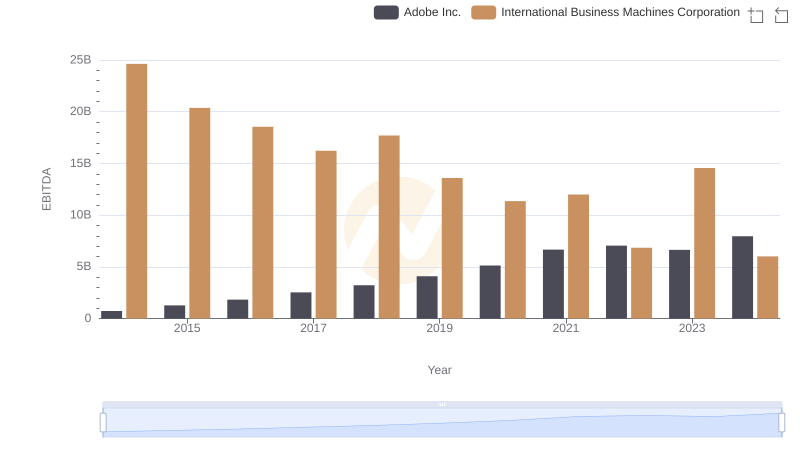
International Business Machines Corporation and Adobe Inc.: A Detailed Examination of EBITDA Performance