| __timestamp | International Business Machines Corporation | Intuit Inc. |
|---|---|---|
| Wednesday, January 1, 2014 | 46386000000 | 668000000 |
| Thursday, January 1, 2015 | 41057000000 | 725000000 |
| Friday, January 1, 2016 | 41403000000 | 752000000 |
| Sunday, January 1, 2017 | 42196000000 | 809000000 |
| Monday, January 1, 2018 | 42655000000 | 977000000 |
| Tuesday, January 1, 2019 | 26181000000 | 1167000000 |
| Wednesday, January 1, 2020 | 24314000000 | 1378000000 |
| Friday, January 1, 2021 | 25865000000 | 1683000000 |
| Saturday, January 1, 2022 | 27842000000 | 2406000000 |
| Sunday, January 1, 2023 | 27560000000 | 3143000000 |
| Monday, January 1, 2024 | 27202000000 | 3465000000 |
Unleashing insights
In the ever-evolving landscape of technology, the cost of revenue is a critical metric that reflects a company's efficiency and market strategy. Over the past decade, International Business Machines Corporation (IBM) and Intuit Inc. have showcased contrasting trajectories in this regard.
From 2014 to 2024, IBM's cost of revenue has seen a significant decline, dropping by approximately 41%. This trend highlights IBM's strategic shift towards more efficient operations and possibly a focus on higher-margin services.
Conversely, Intuit Inc. has experienced a remarkable increase in its cost of revenue, surging by over 400% during the same period. This growth reflects Intuit's aggressive expansion and investment in new technologies and markets.
These trends underscore the dynamic nature of the tech industry, where companies must constantly adapt to maintain their competitive edge.
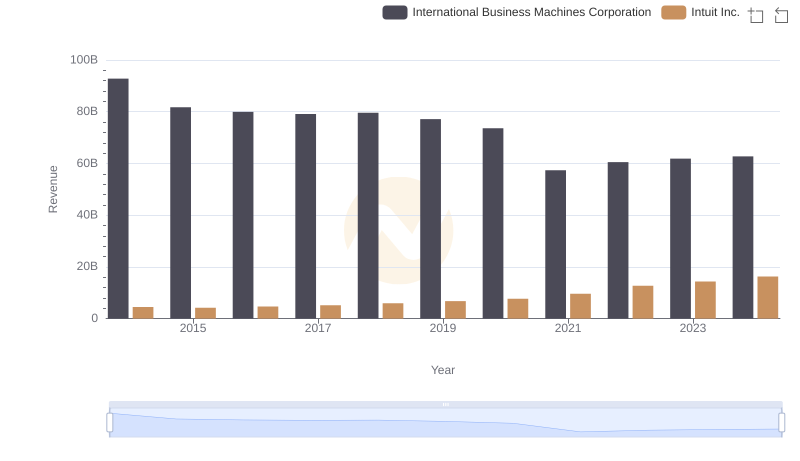
Annual Revenue Comparison: International Business Machines Corporation vs Intuit Inc.
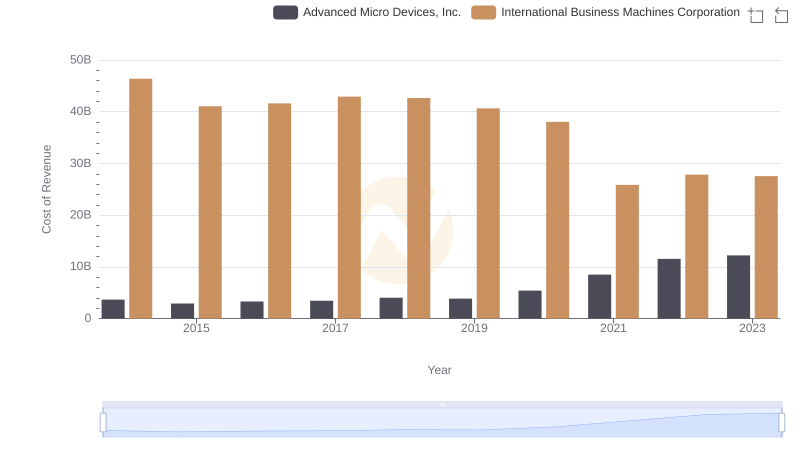
Cost of Revenue Trends: International Business Machines Corporation vs Advanced Micro Devices, Inc.
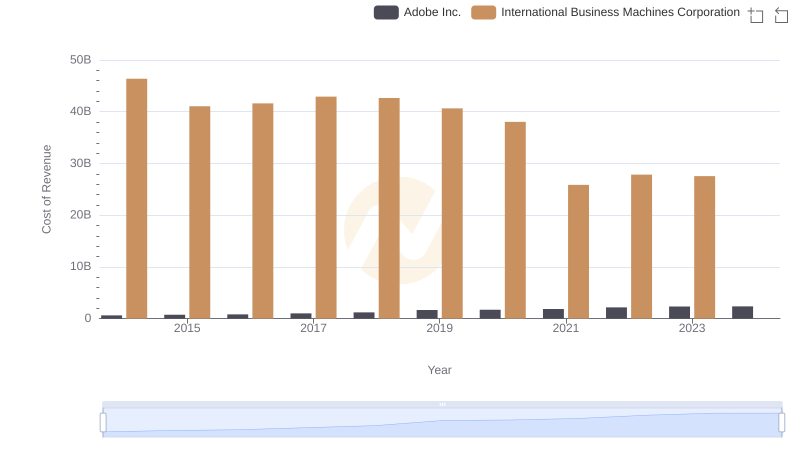
Cost of Revenue Trends: International Business Machines Corporation vs Adobe Inc.
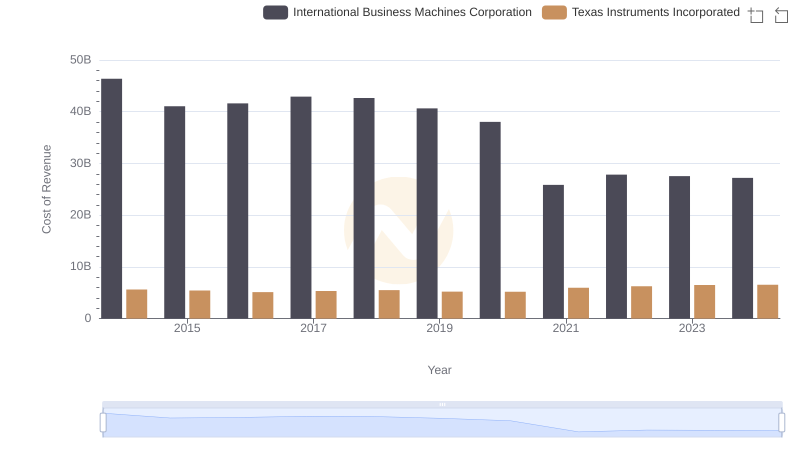
Cost Insights: Breaking Down International Business Machines Corporation and Texas Instruments Incorporated's Expenses
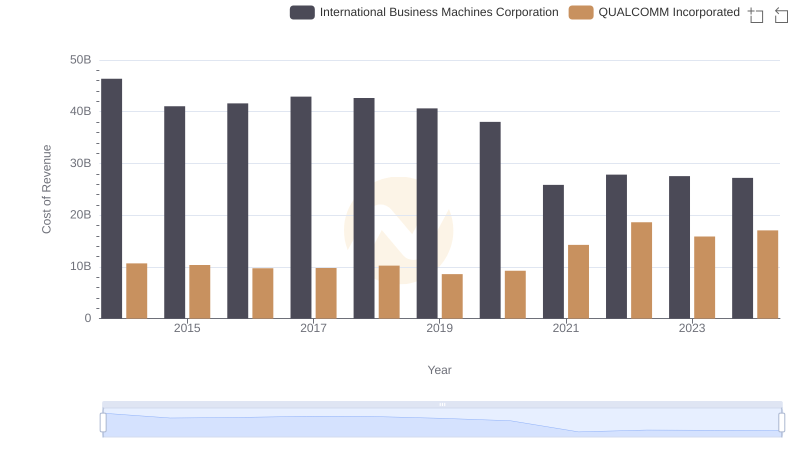
Cost of Revenue Comparison: International Business Machines Corporation vs QUALCOMM Incorporated
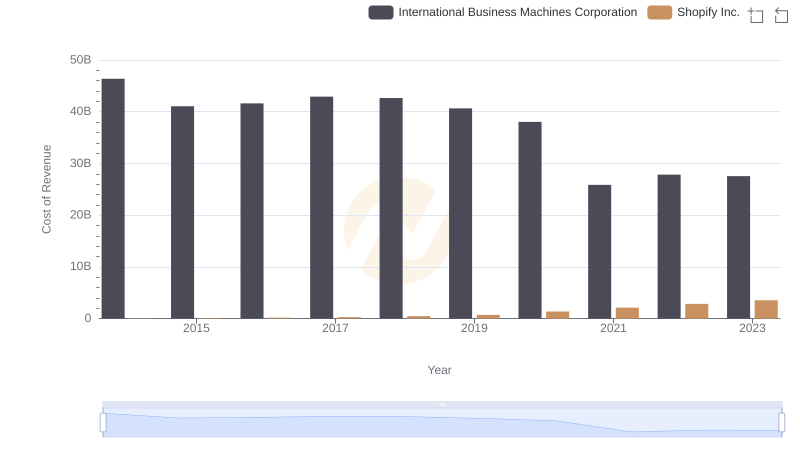
Analyzing Cost of Revenue: International Business Machines Corporation and Shopify Inc.
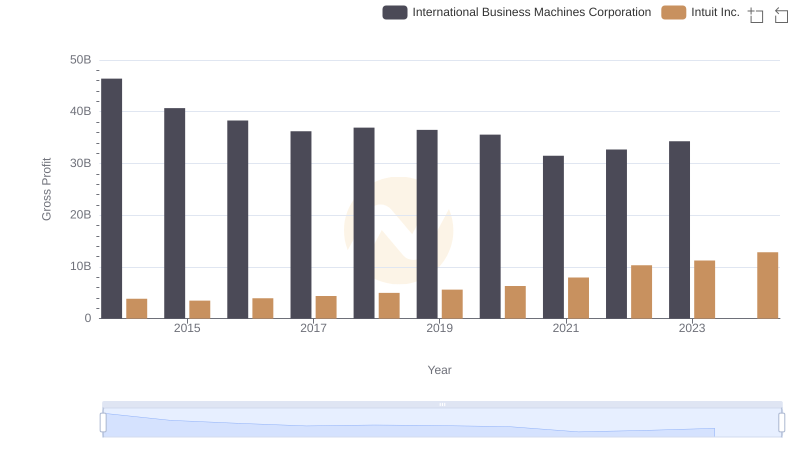
Gross Profit Comparison: International Business Machines Corporation and Intuit Inc. Trends
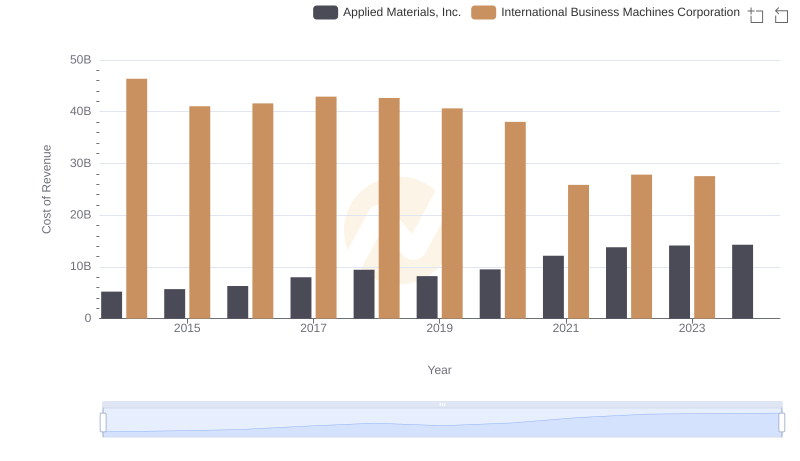
Cost of Revenue: Key Insights for International Business Machines Corporation and Applied Materials, Inc.
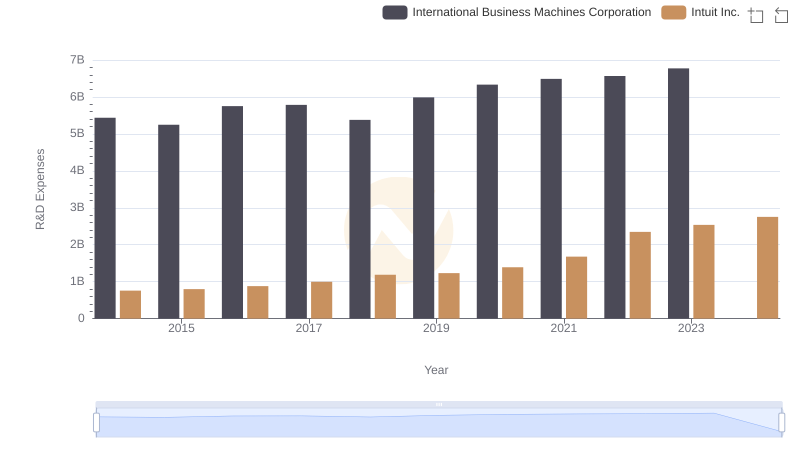
Analyzing R&D Budgets: International Business Machines Corporation vs Intuit Inc.
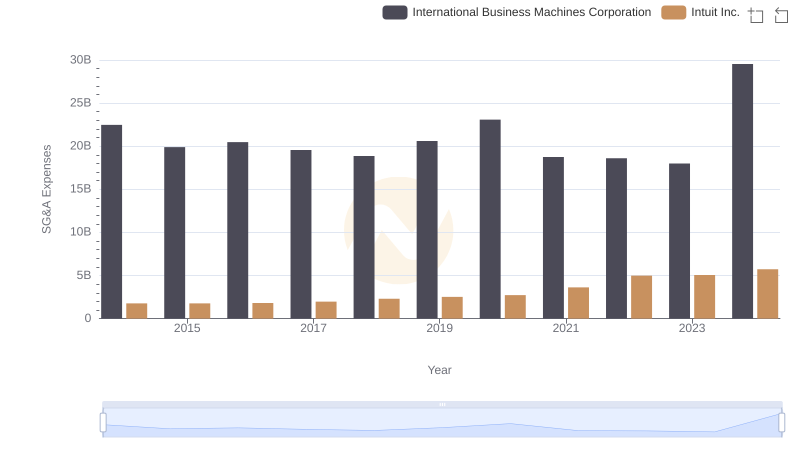
International Business Machines Corporation or Intuit Inc.: Who Manages SG&A Costs Better?
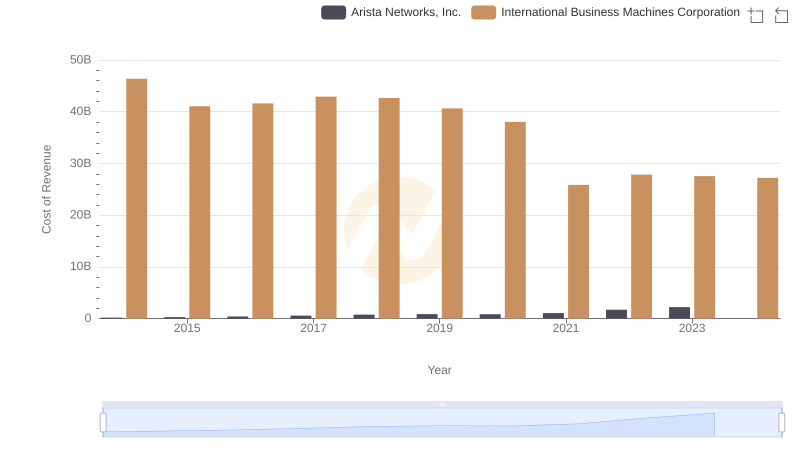
Analyzing Cost of Revenue: International Business Machines Corporation and Arista Networks, Inc.
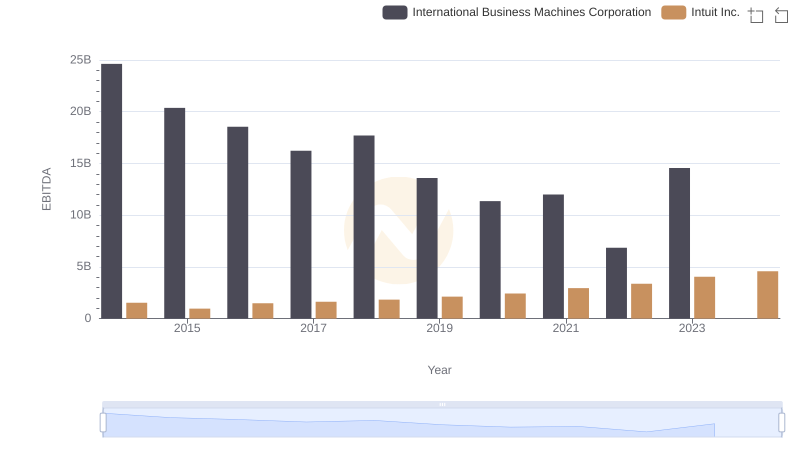
International Business Machines Corporation vs Intuit Inc.: In-Depth EBITDA Performance Comparison