| __timestamp | EMCOR Group, Inc. | XPO Logistics, Inc. |
|---|---|---|
| Wednesday, January 1, 2014 | 907246000 | 381600000 |
| Thursday, January 1, 2015 | 944479000 | 1084800000 |
| Friday, January 1, 2016 | 1037862000 | 2139300000 |
| Sunday, January 1, 2017 | 1147012000 | 2279700000 |
| Monday, January 1, 2018 | 1205453000 | 2541000000 |
| Tuesday, January 1, 2019 | 1355868000 | 2666000000 |
| Wednesday, January 1, 2020 | 1395382000 | 2563000000 |
| Friday, January 1, 2021 | 1501737000 | 1994000000 |
| Saturday, January 1, 2022 | 1603594000 | 1227000000 |
| Sunday, January 1, 2023 | 2089339000 | 770000000 |
| Monday, January 1, 2024 | 915000000 |
Unveiling the hidden dimensions of data
In the ever-evolving landscape of the industrial and logistics sectors, EMCOR Group, Inc. and XPO Logistics, Inc. have emerged as formidable players. Over the past decade, these companies have showcased contrasting trajectories in their gross profit margins. From 2014 to 2023, EMCOR Group, Inc. has seen a steady rise in its gross profit, culminating in a remarkable 130% increase by 2023. In contrast, XPO Logistics, Inc. experienced a peak in 2019, with a subsequent decline, resulting in a 71% drop by 2023.
This divergence highlights the dynamic nature of the industry, where strategic decisions and market conditions can significantly impact financial outcomes. As we delve into these trends, it becomes evident that adaptability and foresight are crucial for sustained growth in this competitive arena.
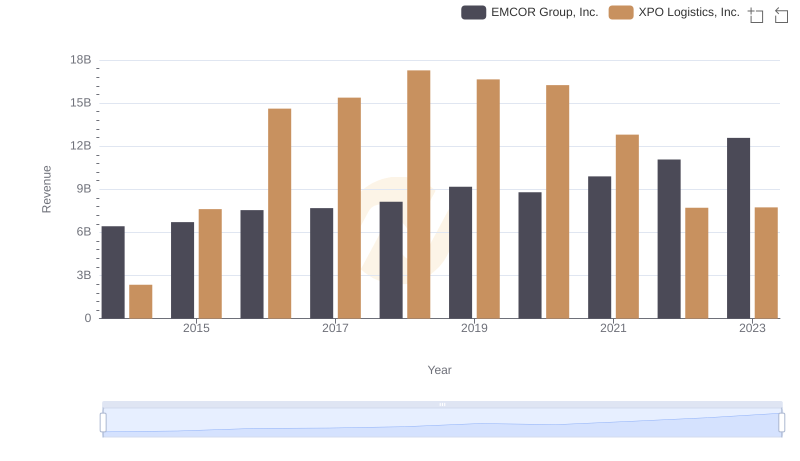
Annual Revenue Comparison: EMCOR Group, Inc. vs XPO Logistics, Inc.
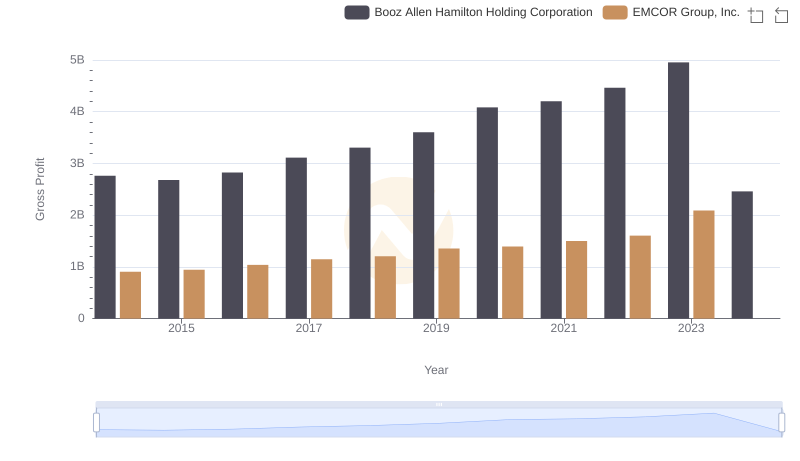
Gross Profit Trends Compared: EMCOR Group, Inc. vs Booz Allen Hamilton Holding Corporation
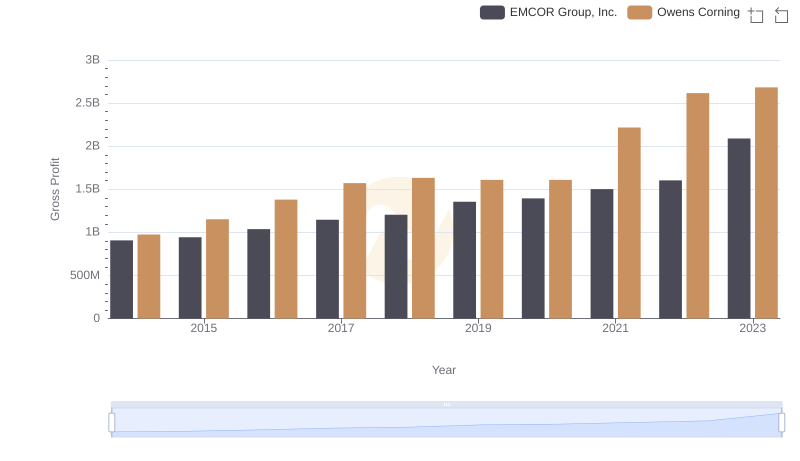
Gross Profit Trends Compared: EMCOR Group, Inc. vs Owens Corning
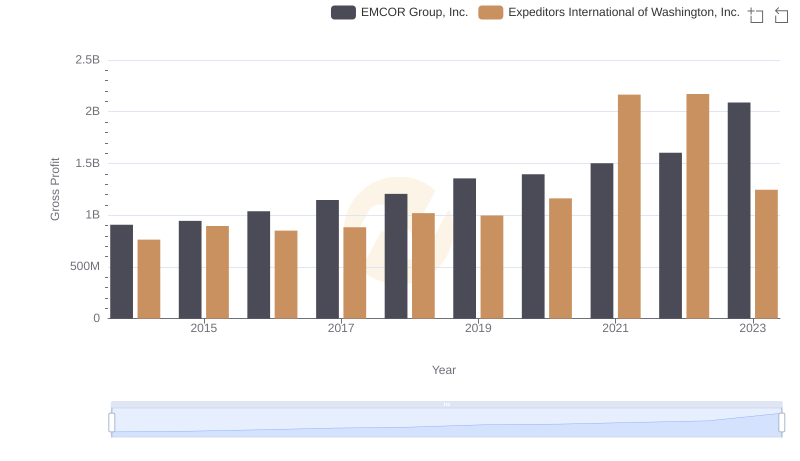
Gross Profit Analysis: Comparing EMCOR Group, Inc. and Expeditors International of Washington, Inc.
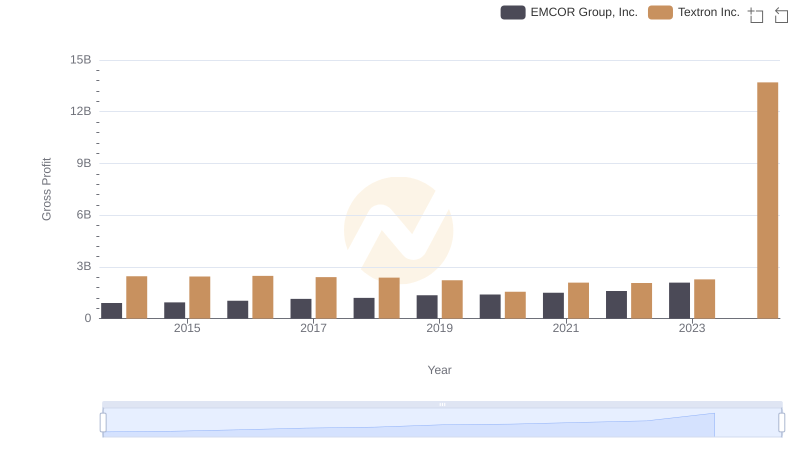
Gross Profit Comparison: EMCOR Group, Inc. and Textron Inc. Trends
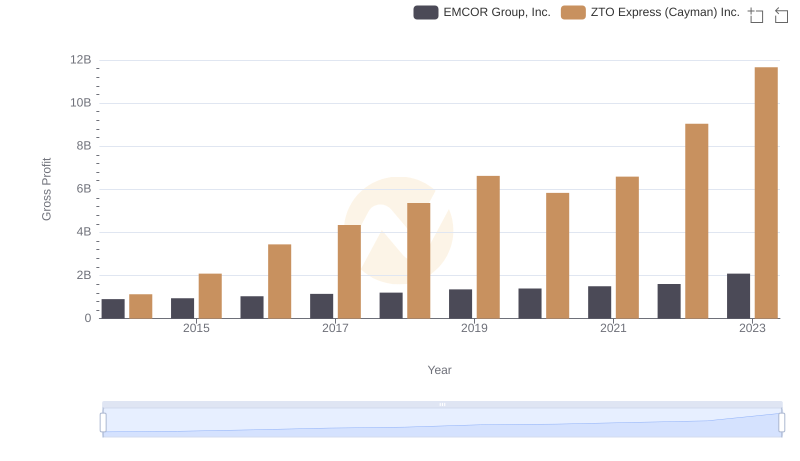
Gross Profit Comparison: EMCOR Group, Inc. and ZTO Express (Cayman) Inc. Trends
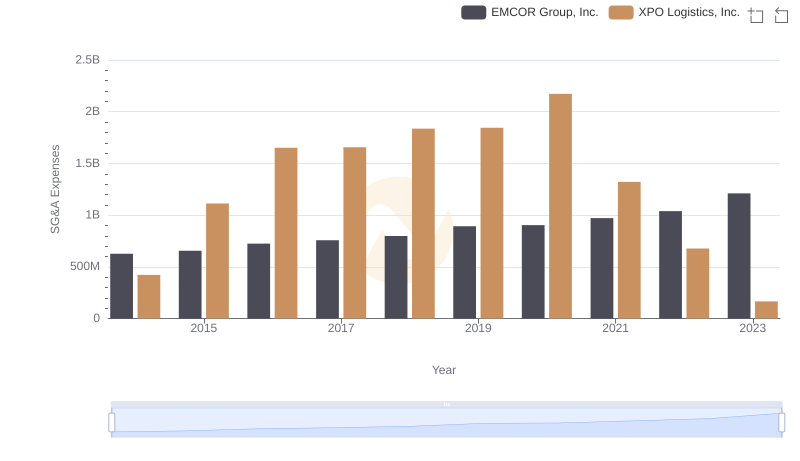
Selling, General, and Administrative Costs: EMCOR Group, Inc. vs XPO Logistics, Inc.
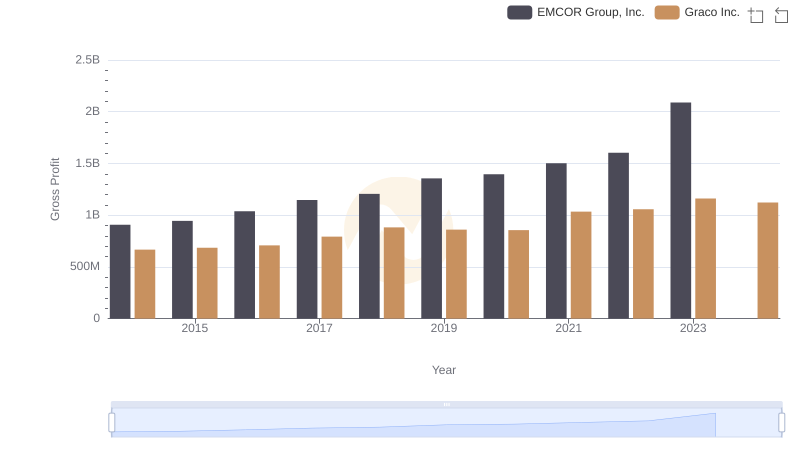
EMCOR Group, Inc. and Graco Inc.: A Detailed Gross Profit Analysis
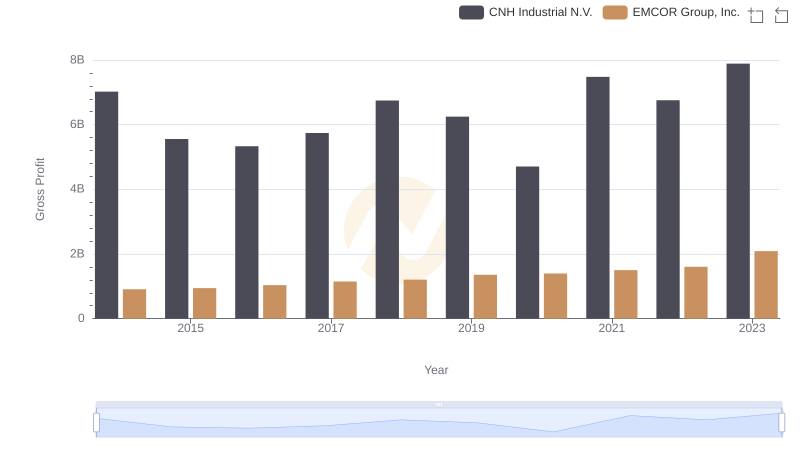
Key Insights on Gross Profit: EMCOR Group, Inc. vs CNH Industrial N.V.
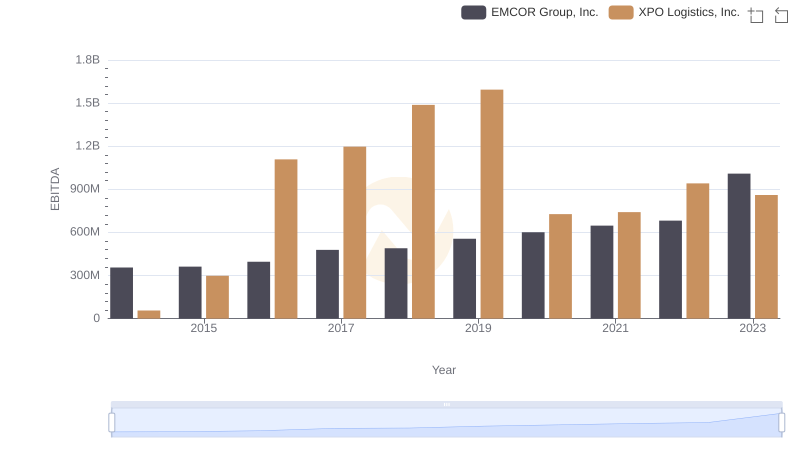
A Professional Review of EBITDA: EMCOR Group, Inc. Compared to XPO Logistics, Inc.