| __timestamp | EMCOR Group, Inc. | XPO Logistics, Inc. |
|---|---|---|
| Wednesday, January 1, 2014 | 6424965000 | 2356600000 |
| Thursday, January 1, 2015 | 6718726000 | 7623200000 |
| Friday, January 1, 2016 | 7551524000 | 14619400000 |
| Sunday, January 1, 2017 | 7686999000 | 15380800000 |
| Monday, January 1, 2018 | 8130631000 | 17279000000 |
| Tuesday, January 1, 2019 | 9174611000 | 16648000000 |
| Wednesday, January 1, 2020 | 8797061000 | 16252000000 |
| Friday, January 1, 2021 | 9903580000 | 12806000000 |
| Saturday, January 1, 2022 | 11076120000 | 7718000000 |
| Sunday, January 1, 2023 | 12582873000 | 7744000000 |
| Monday, January 1, 2024 | 8072000000 |
Data in motion
In the ever-evolving landscape of the logistics and construction industries, EMCOR Group, Inc. and XPO Logistics, Inc. have emerged as formidable players. Over the past decade, from 2014 to 2023, these companies have demonstrated remarkable revenue trajectories, reflecting their strategic prowess and market adaptability.
EMCOR Group, Inc. has shown a steady upward trend in revenue, growing by approximately 96% over the decade. Starting at $6.4 billion in 2014, EMCOR's revenue surged to $12.6 billion by 2023, highlighting its robust expansion and operational efficiency.
XPO Logistics, Inc., on the other hand, experienced a more volatile revenue journey. From a modest $2.4 billion in 2014, XPO's revenue peaked at $17.3 billion in 2018, before stabilizing around $7.7 billion in 2023. This fluctuation underscores the dynamic nature of the logistics sector.
Both companies exemplify resilience and adaptability, navigating through economic shifts and industry challenges to maintain their competitive edge.
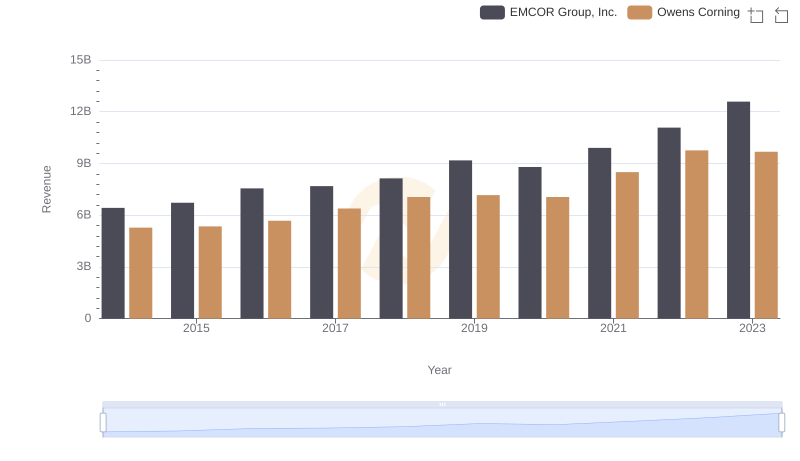
EMCOR Group, Inc. vs Owens Corning: Examining Key Revenue Metrics
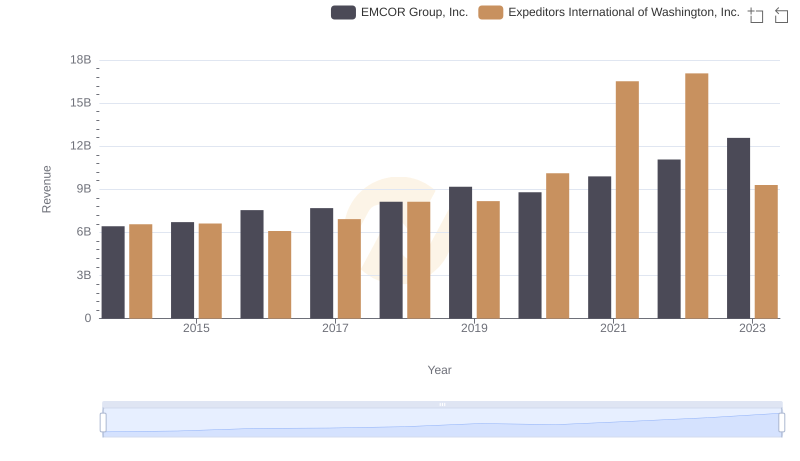
EMCOR Group, Inc. or Expeditors International of Washington, Inc.: Who Leads in Yearly Revenue?
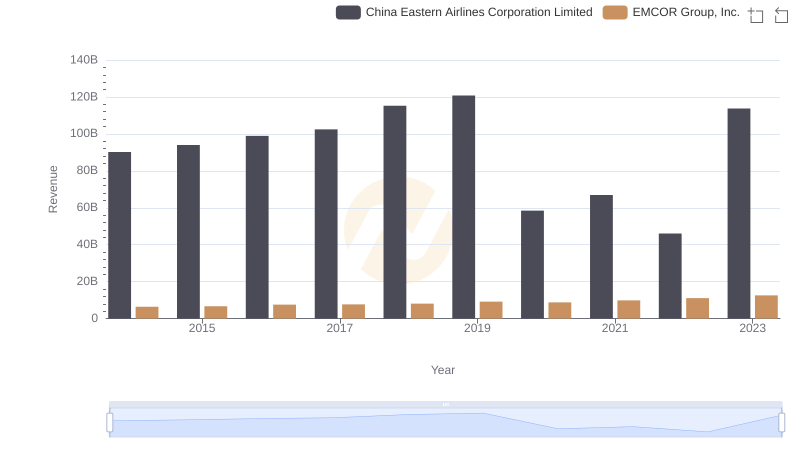
EMCOR Group, Inc. and China Eastern Airlines Corporation Limited: A Comprehensive Revenue Analysis
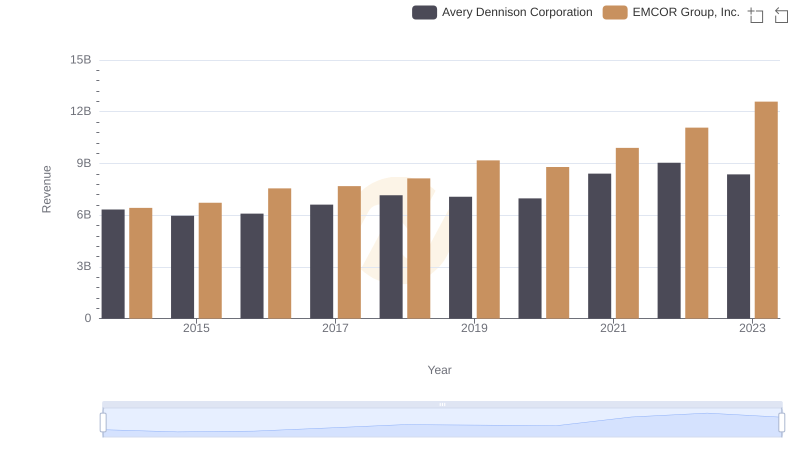
Comparing Revenue Performance: EMCOR Group, Inc. or Avery Dennison Corporation?
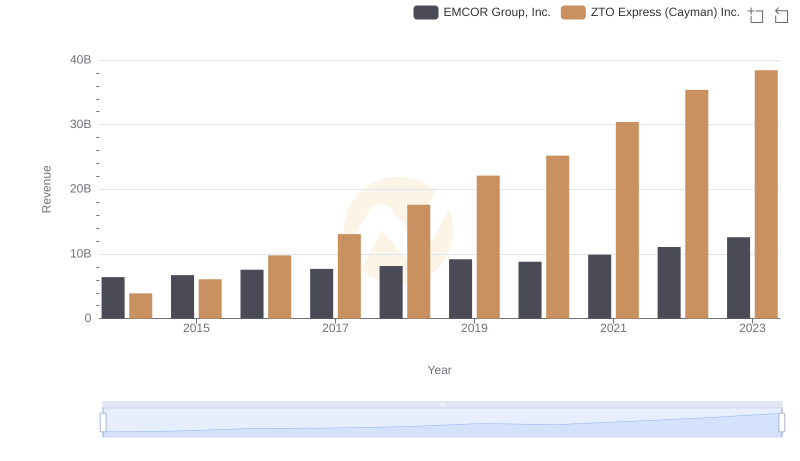
Breaking Down Revenue Trends: EMCOR Group, Inc. vs ZTO Express (Cayman) Inc.
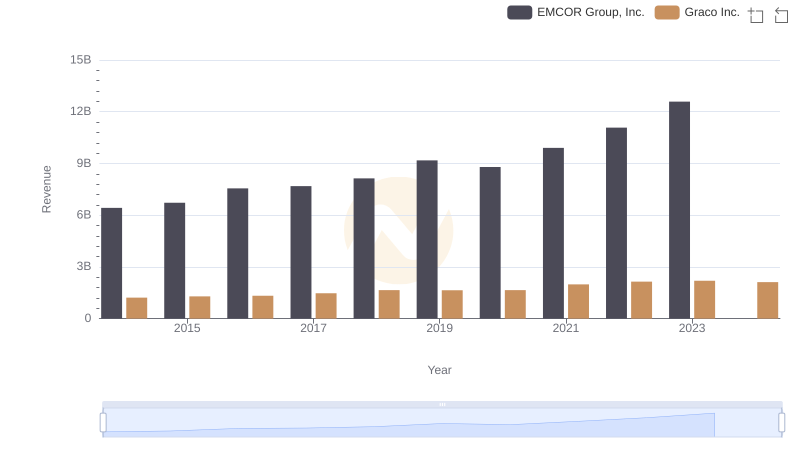
Annual Revenue Comparison: EMCOR Group, Inc. vs Graco Inc.
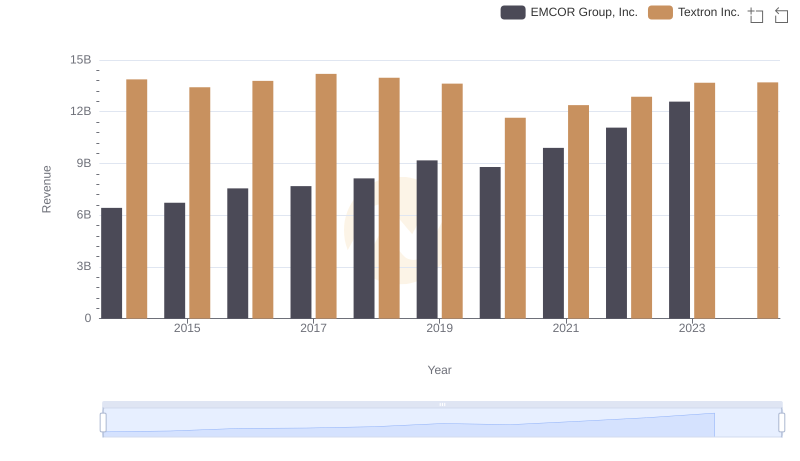
Who Generates More Revenue? EMCOR Group, Inc. or Textron Inc.
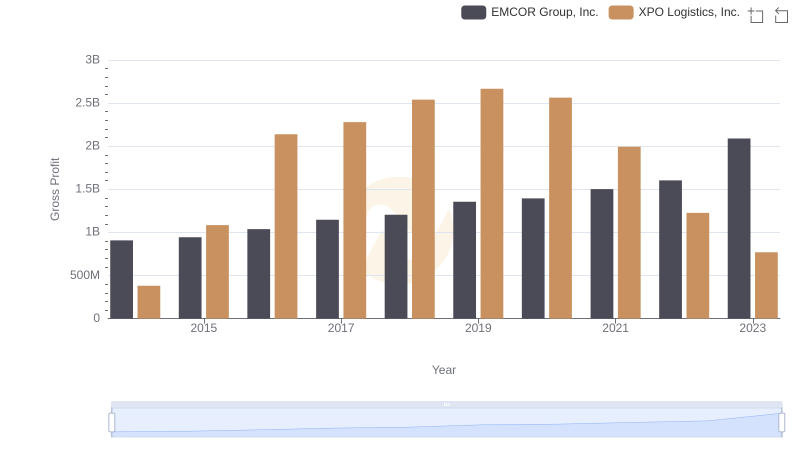
Gross Profit Comparison: EMCOR Group, Inc. and XPO Logistics, Inc. Trends
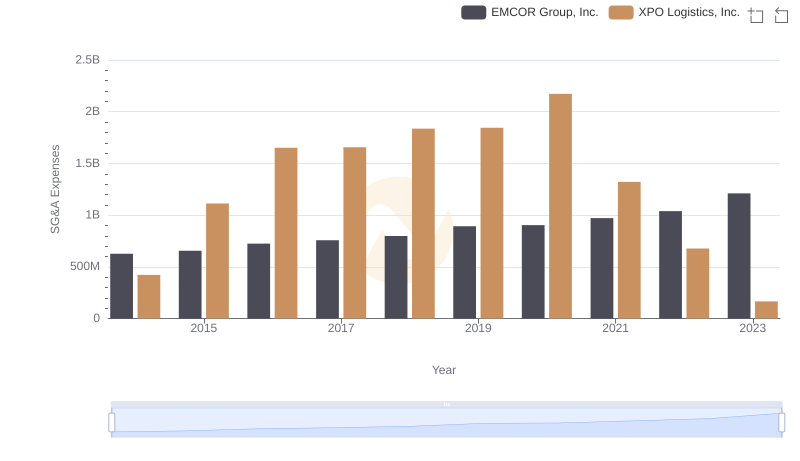
Selling, General, and Administrative Costs: EMCOR Group, Inc. vs XPO Logistics, Inc.
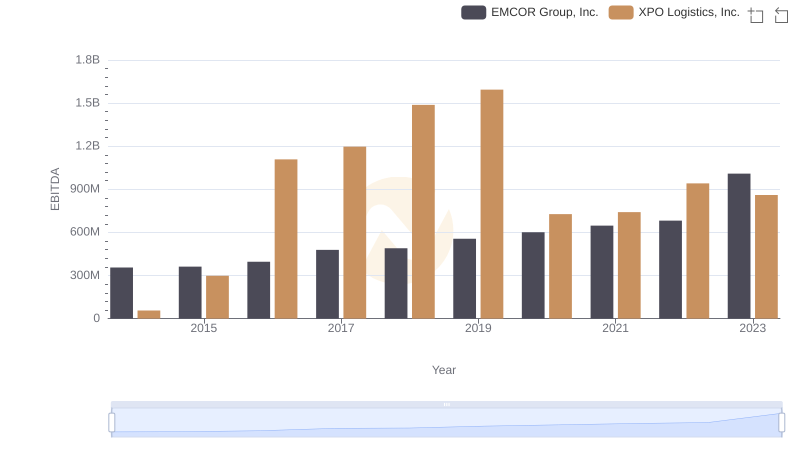
A Professional Review of EBITDA: EMCOR Group, Inc. Compared to XPO Logistics, Inc.