| __timestamp | EMCOR Group, Inc. | Textron Inc. |
|---|---|---|
| Wednesday, January 1, 2014 | 907246000 | 2457000000 |
| Thursday, January 1, 2015 | 944479000 | 2444000000 |
| Friday, January 1, 2016 | 1037862000 | 2477000000 |
| Sunday, January 1, 2017 | 1147012000 | 2403000000 |
| Monday, January 1, 2018 | 1205453000 | 2378000000 |
| Tuesday, January 1, 2019 | 1355868000 | 2224000000 |
| Wednesday, January 1, 2020 | 1395382000 | 1557000000 |
| Friday, January 1, 2021 | 1501737000 | 2085000000 |
| Saturday, January 1, 2022 | 1603594000 | 2069000000 |
| Sunday, January 1, 2023 | 2089339000 | 2278000000 |
| Monday, January 1, 2024 | 2502000000 |
Infusing magic into the data realm
In the ever-evolving landscape of the industrial sector, EMCOR Group, Inc. and Textron Inc. have showcased intriguing financial trajectories over the past decade. From 2014 to 2023, EMCOR Group, Inc. has seen a steady rise in gross profit, culminating in a remarkable 130% increase by 2023. This growth reflects the company's robust operational strategies and market adaptability.
Conversely, Textron Inc. experienced a more volatile journey. While starting strong in 2014, Textron's gross profit dipped significantly in 2020, only to rebound by 2023 with a 46% increase from its lowest point. This fluctuation highlights Textron's resilience and ability to navigate economic challenges.
Interestingly, the data for 2024 is incomplete, leaving room for speculation on future trends. As these industry giants continue to evolve, their financial performances remain a testament to their strategic prowess.
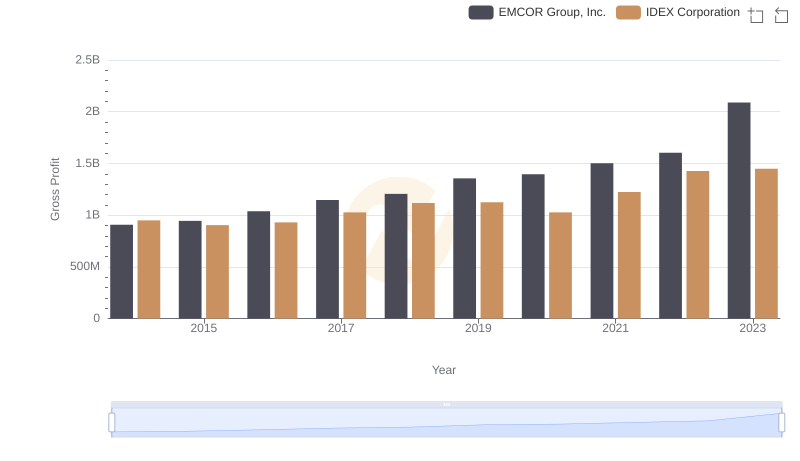
EMCOR Group, Inc. vs IDEX Corporation: A Gross Profit Performance Breakdown
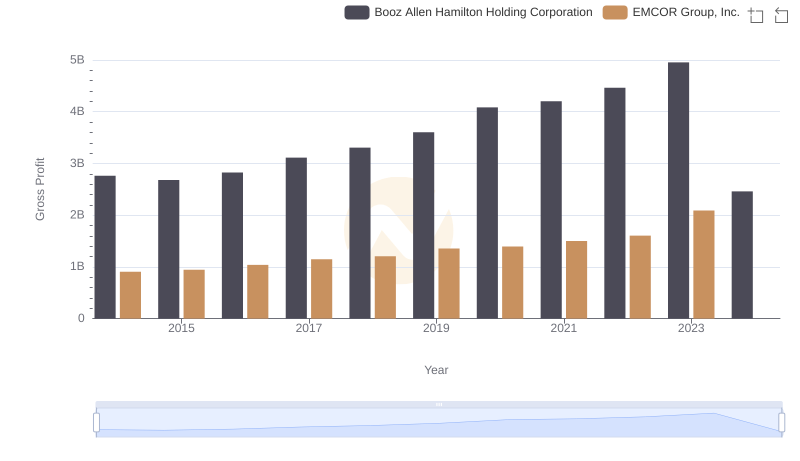
Gross Profit Trends Compared: EMCOR Group, Inc. vs Booz Allen Hamilton Holding Corporation
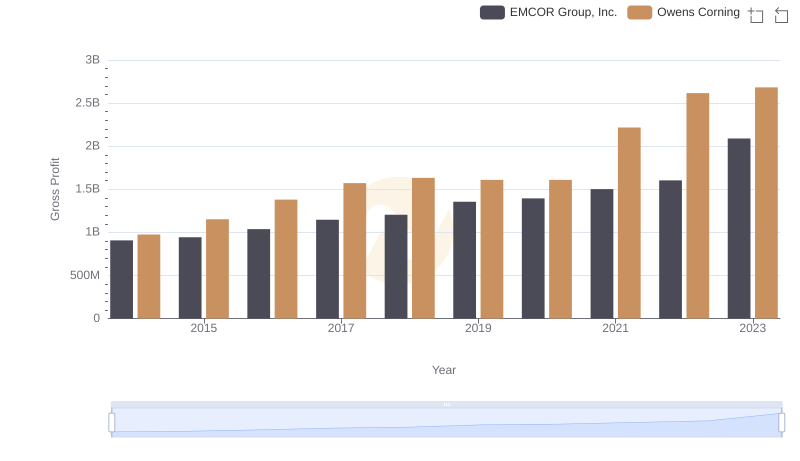
Gross Profit Trends Compared: EMCOR Group, Inc. vs Owens Corning
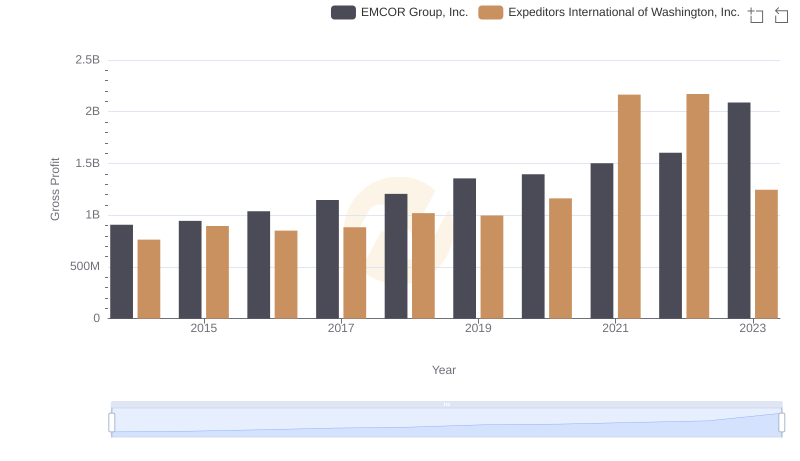
Gross Profit Analysis: Comparing EMCOR Group, Inc. and Expeditors International of Washington, Inc.
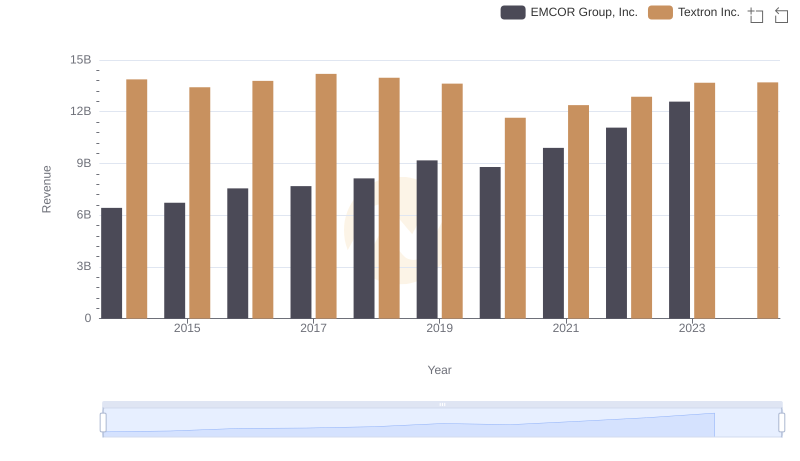
Who Generates More Revenue? EMCOR Group, Inc. or Textron Inc.
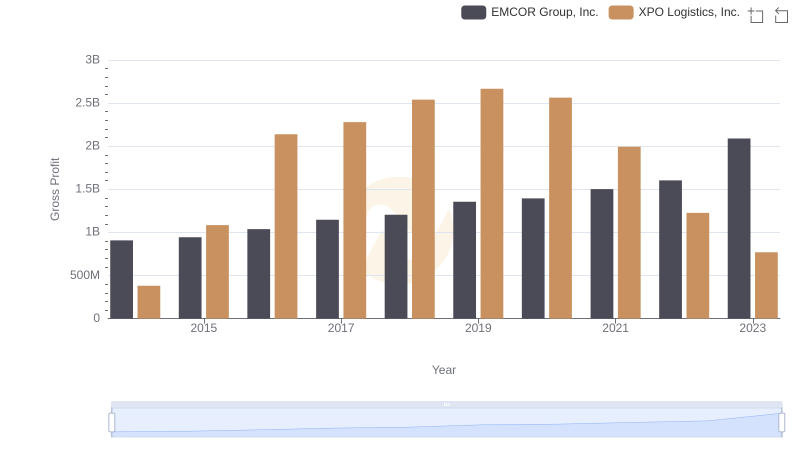
Gross Profit Comparison: EMCOR Group, Inc. and XPO Logistics, Inc. Trends
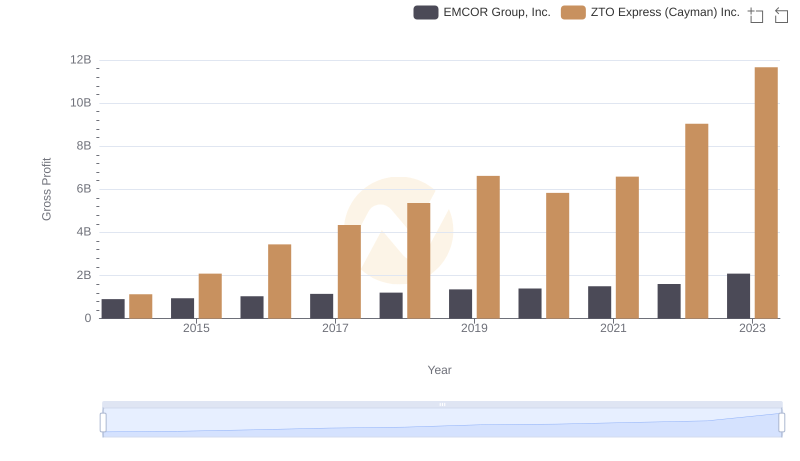
Gross Profit Comparison: EMCOR Group, Inc. and ZTO Express (Cayman) Inc. Trends
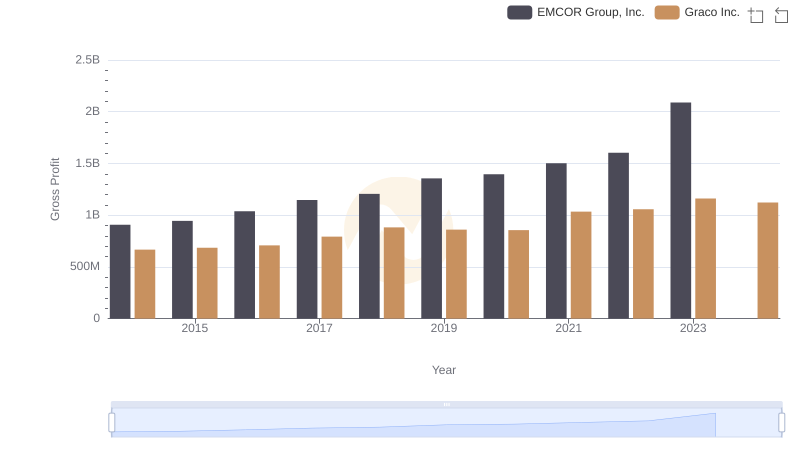
EMCOR Group, Inc. and Graco Inc.: A Detailed Gross Profit Analysis
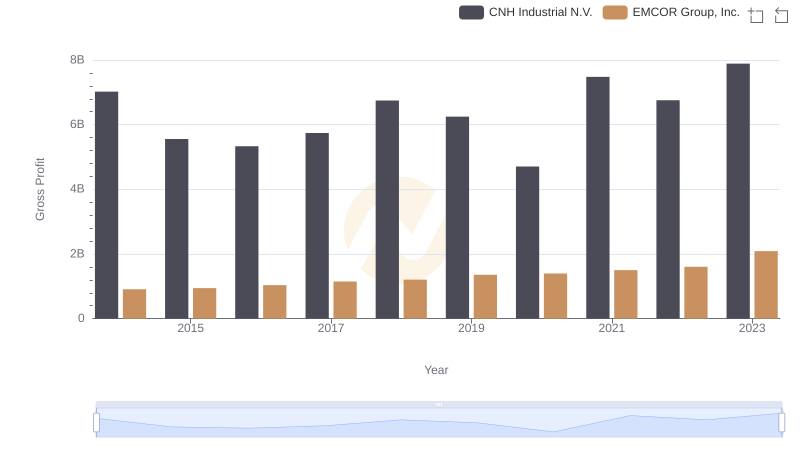
Key Insights on Gross Profit: EMCOR Group, Inc. vs CNH Industrial N.V.
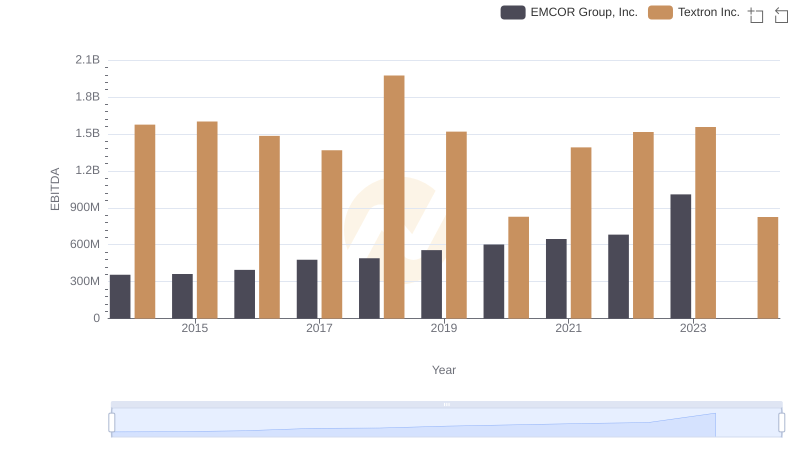
EBITDA Analysis: Evaluating EMCOR Group, Inc. Against Textron Inc.