| __timestamp | EMCOR Group, Inc. | XPO Logistics, Inc. |
|---|---|---|
| Wednesday, January 1, 2014 | 626478000 | 422500000 |
| Thursday, January 1, 2015 | 656573000 | 1113400000 |
| Friday, January 1, 2016 | 725538000 | 1651200000 |
| Sunday, January 1, 2017 | 757062000 | 1656500000 |
| Monday, January 1, 2018 | 799157000 | 1837000000 |
| Tuesday, January 1, 2019 | 893453000 | 1845000000 |
| Wednesday, January 1, 2020 | 903584000 | 2172000000 |
| Friday, January 1, 2021 | 970937000 | 1322000000 |
| Saturday, January 1, 2022 | 1038717000 | 678000000 |
| Sunday, January 1, 2023 | 1211233000 | 167000000 |
| Monday, January 1, 2024 | 134000000 |
Unleashing insights
In the competitive landscape of the logistics and construction industries, understanding operational costs is crucial. This chart compares the Selling, General, and Administrative (SG&A) expenses of EMCOR Group, Inc. and XPO Logistics, Inc. from 2014 to 2023. Over this period, EMCOR Group, Inc. has seen a steady increase in SG&A expenses, growing by approximately 93% from 2014 to 2023. In contrast, XPO Logistics, Inc. experienced a dramatic rise in expenses, peaking in 2020 with a 414% increase from 2014, before a sharp decline by 2023. This fluctuation highlights the dynamic nature of the logistics sector, where strategic shifts and market conditions can significantly impact financial metrics. As businesses navigate these challenges, understanding such trends is vital for investors and stakeholders aiming to make informed decisions.
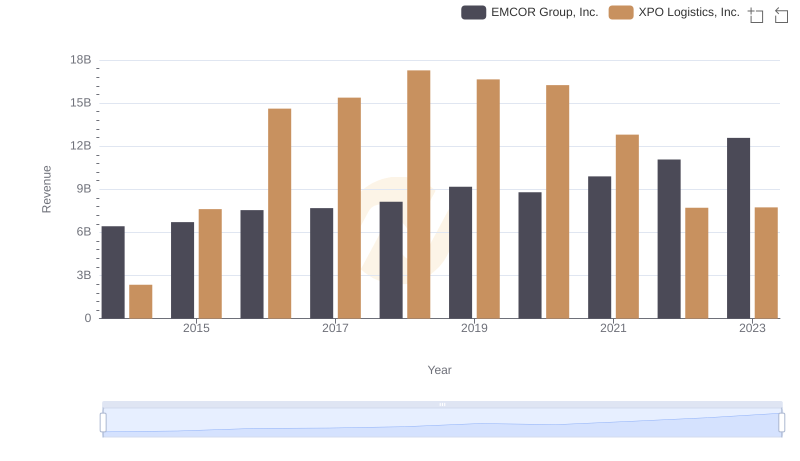
Annual Revenue Comparison: EMCOR Group, Inc. vs XPO Logistics, Inc.
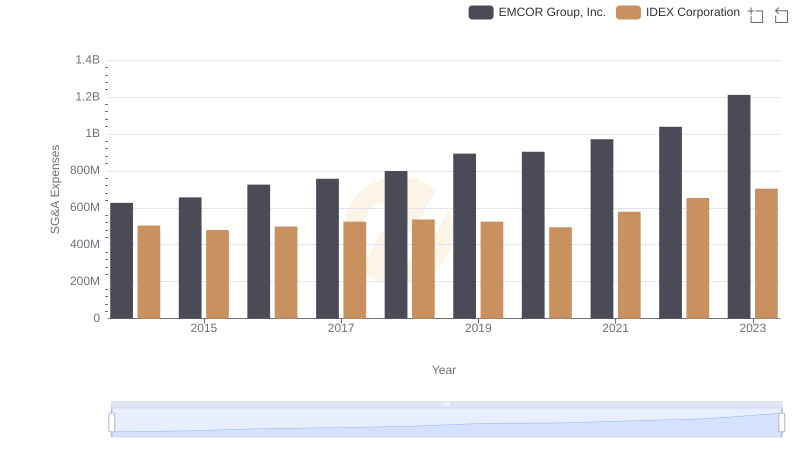
Breaking Down SG&A Expenses: EMCOR Group, Inc. vs IDEX Corporation
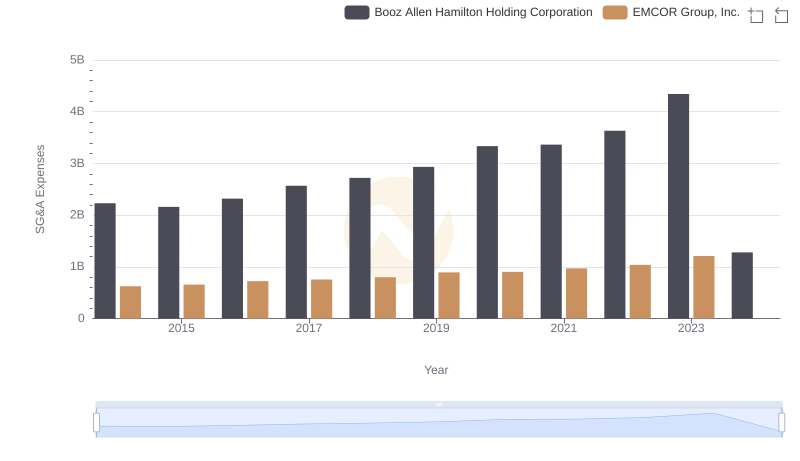
EMCOR Group, Inc. vs Booz Allen Hamilton Holding Corporation: SG&A Expense Trends
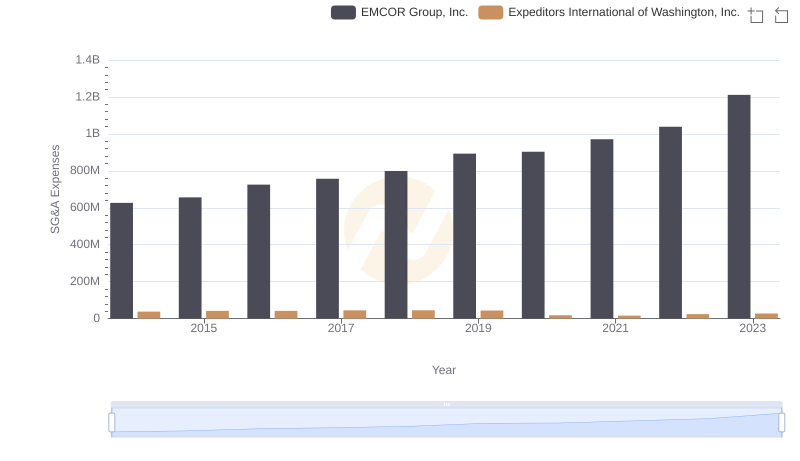
EMCOR Group, Inc. and Expeditors International of Washington, Inc.: SG&A Spending Patterns Compared
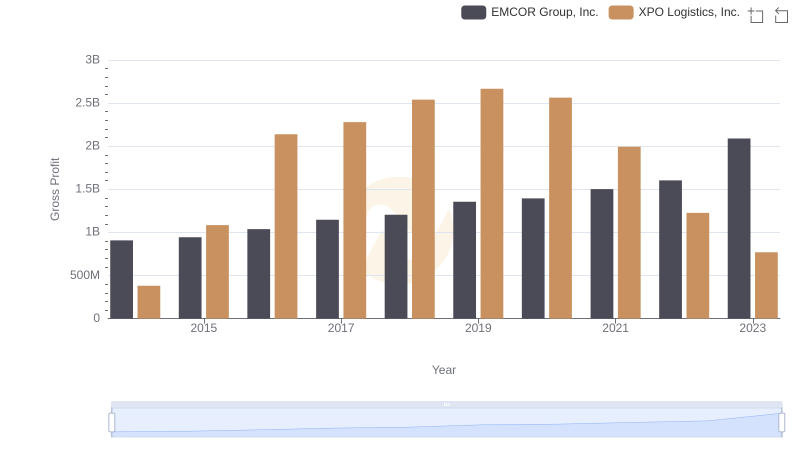
Gross Profit Comparison: EMCOR Group, Inc. and XPO Logistics, Inc. Trends
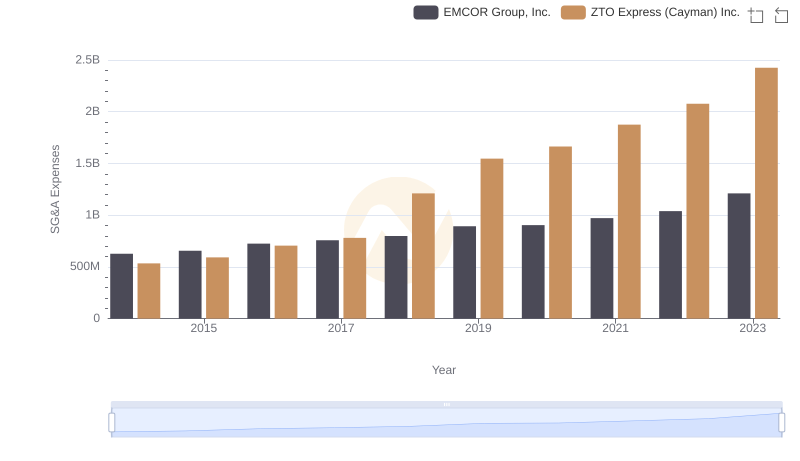
Comparing SG&A Expenses: EMCOR Group, Inc. vs ZTO Express (Cayman) Inc. Trends and Insights
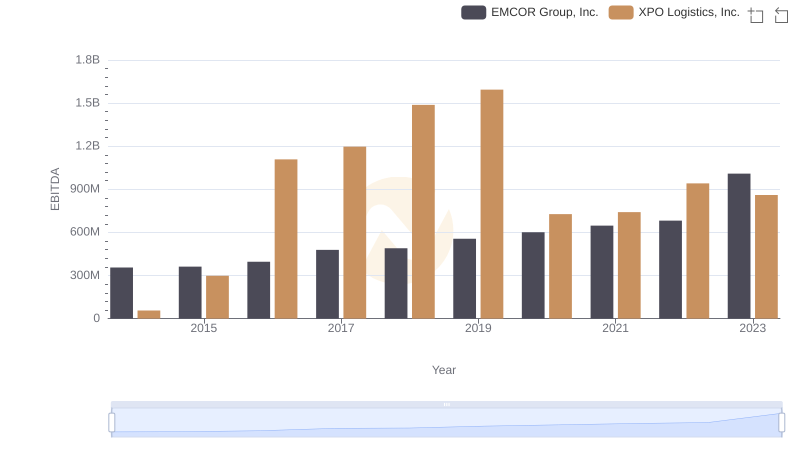
A Professional Review of EBITDA: EMCOR Group, Inc. Compared to XPO Logistics, Inc.
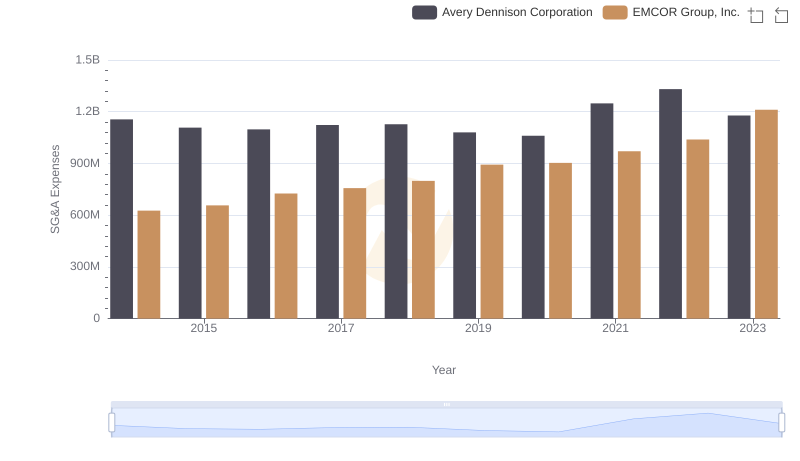
Breaking Down SG&A Expenses: EMCOR Group, Inc. vs Avery Dennison Corporation