| __timestamp | EMCOR Group, Inc. | Textron Inc. |
|---|---|---|
| Wednesday, January 1, 2014 | 6424965000 | 13878000000 |
| Thursday, January 1, 2015 | 6718726000 | 13423000000 |
| Friday, January 1, 2016 | 7551524000 | 13788000000 |
| Sunday, January 1, 2017 | 7686999000 | 14198000000 |
| Monday, January 1, 2018 | 8130631000 | 13972000000 |
| Tuesday, January 1, 2019 | 9174611000 | 13630000000 |
| Wednesday, January 1, 2020 | 8797061000 | 11651000000 |
| Friday, January 1, 2021 | 9903580000 | 12382000000 |
| Saturday, January 1, 2022 | 11076120000 | 12869000000 |
| Sunday, January 1, 2023 | 12582873000 | 13683000000 |
| Monday, January 1, 2024 | 13702000000 |
In pursuit of knowledge
In the competitive landscape of American industry, EMCOR Group, Inc. and Textron Inc. have been key players. Over the past decade, Textron Inc. has consistently outpaced EMCOR in revenue generation. From 2014 to 2023, Textron's revenue grew by approximately 1%, reaching a peak in 2017 and maintaining a steady trajectory thereafter. Meanwhile, EMCOR Group saw a more dynamic growth, with a remarkable 96% increase in revenue from 2014 to 2023, highlighting its aggressive expansion strategy.
Despite EMCOR's impressive growth, Textron's revenue remained about 10% higher on average. The data for 2024 is incomplete, but the trend suggests Textron's dominance continues. This analysis underscores the importance of strategic growth and market positioning in maintaining revenue leadership.
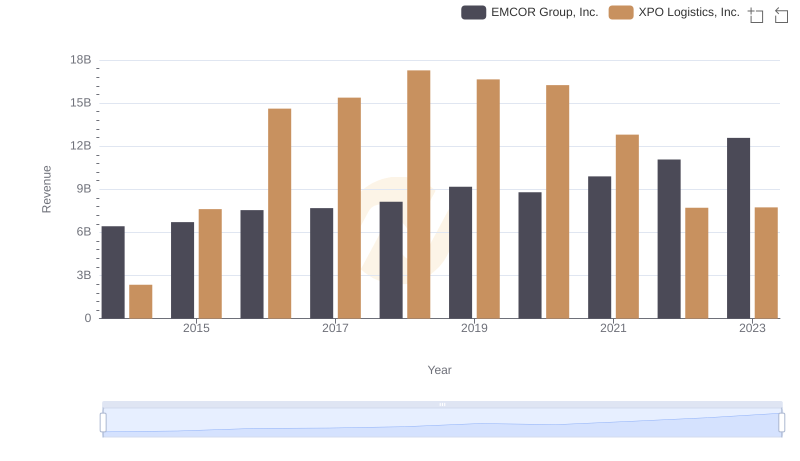
Annual Revenue Comparison: EMCOR Group, Inc. vs XPO Logistics, Inc.
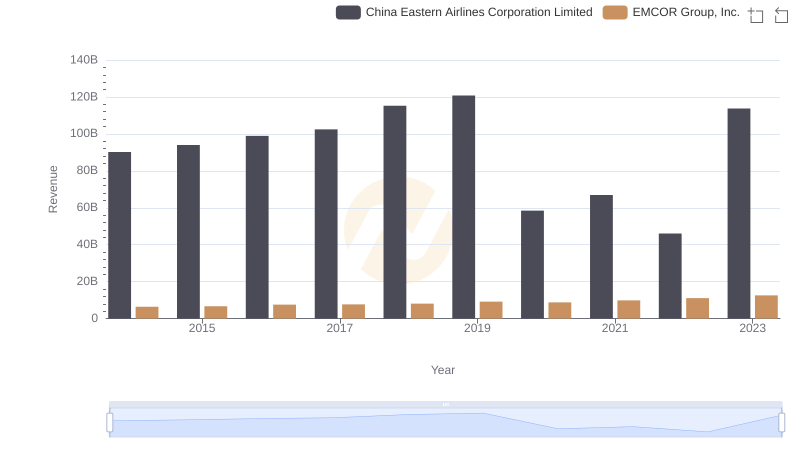
EMCOR Group, Inc. and China Eastern Airlines Corporation Limited: A Comprehensive Revenue Analysis
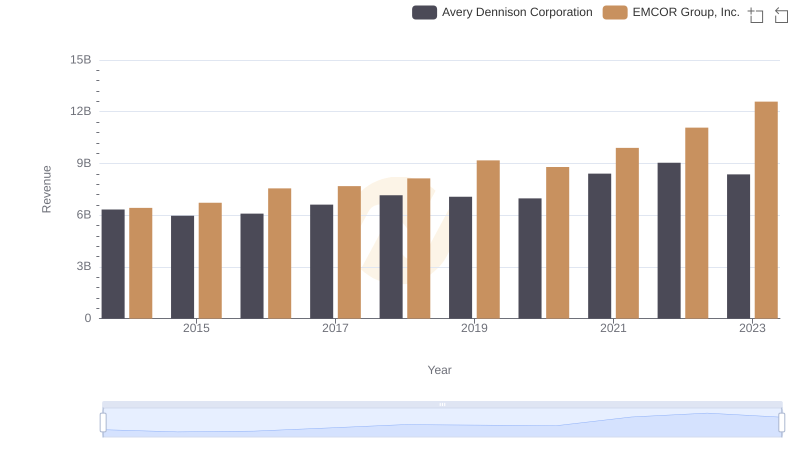
Comparing Revenue Performance: EMCOR Group, Inc. or Avery Dennison Corporation?
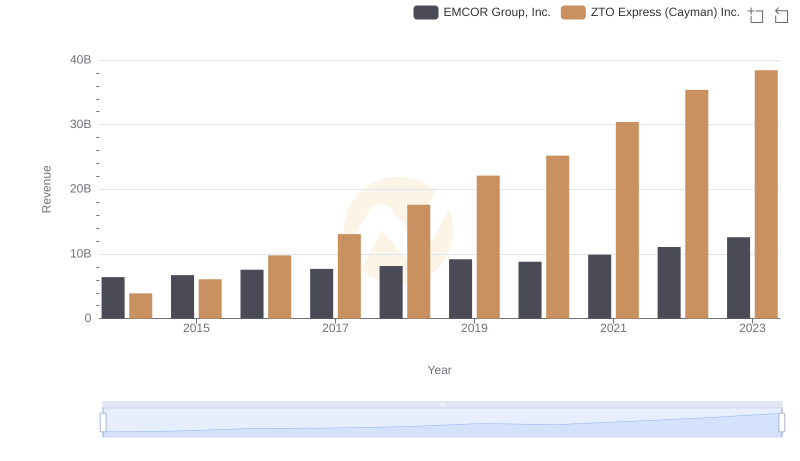
Breaking Down Revenue Trends: EMCOR Group, Inc. vs ZTO Express (Cayman) Inc.
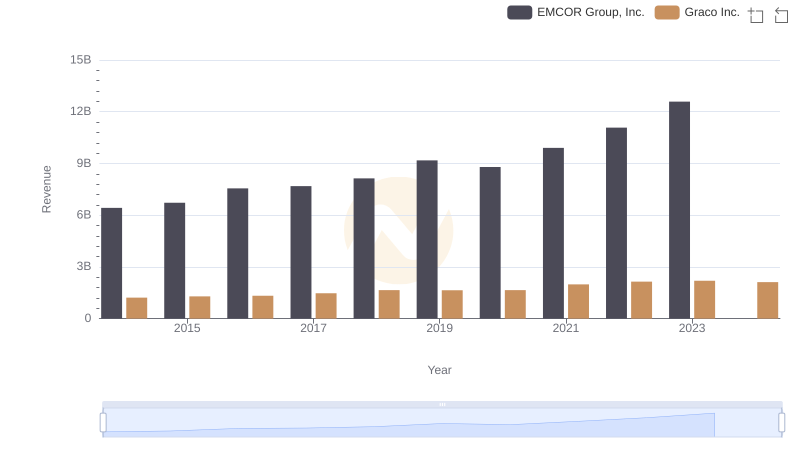
Annual Revenue Comparison: EMCOR Group, Inc. vs Graco Inc.
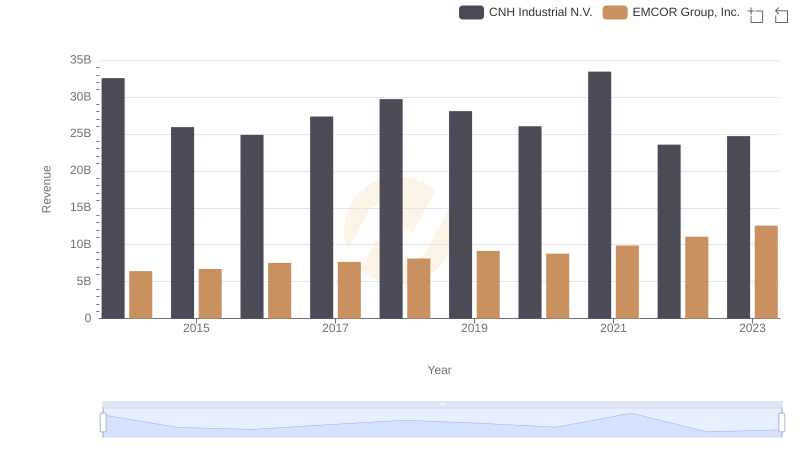
Comparing Revenue Performance: EMCOR Group, Inc. or CNH Industrial N.V.?
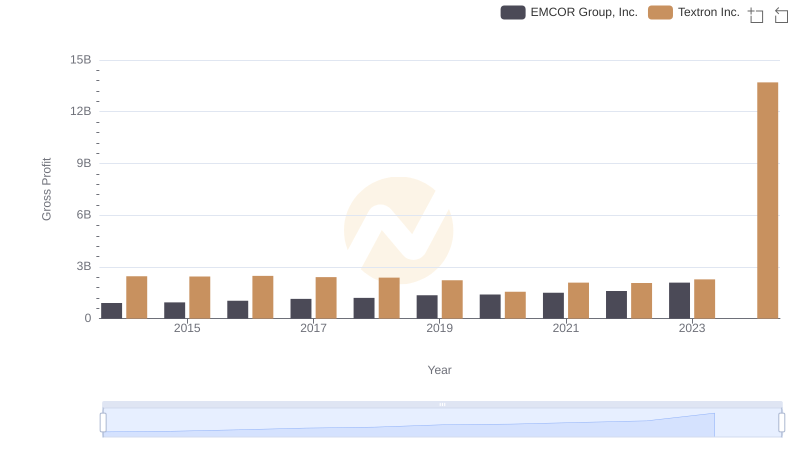
Gross Profit Comparison: EMCOR Group, Inc. and Textron Inc. Trends
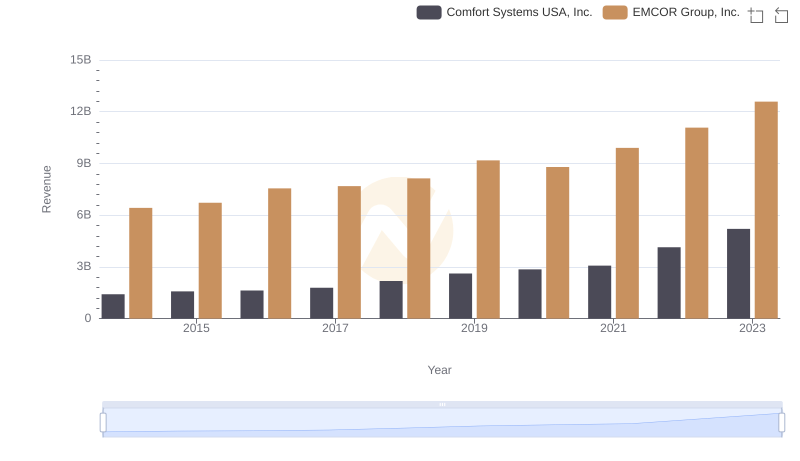
EMCOR Group, Inc. vs Comfort Systems USA, Inc.: Examining Key Revenue Metrics
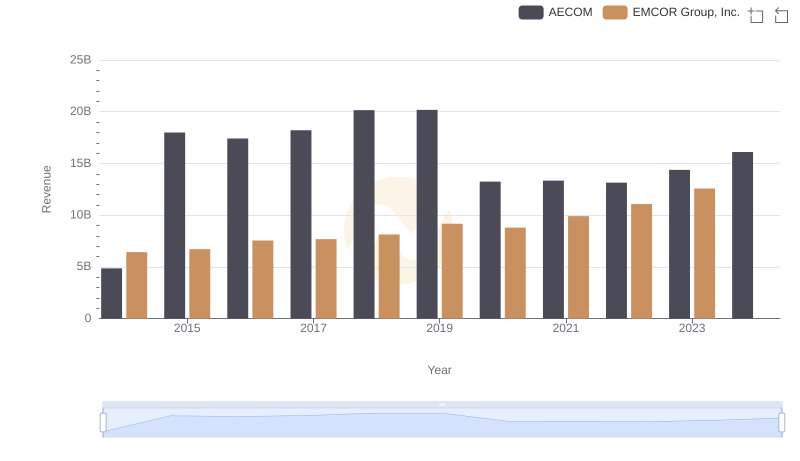
Revenue Insights: EMCOR Group, Inc. and AECOM Performance Compared
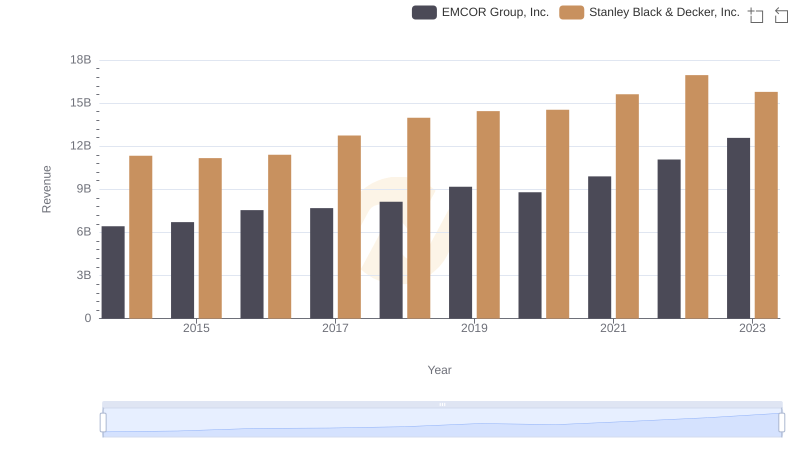
EMCOR Group, Inc. or Stanley Black & Decker, Inc.: Who Leads in Yearly Revenue?
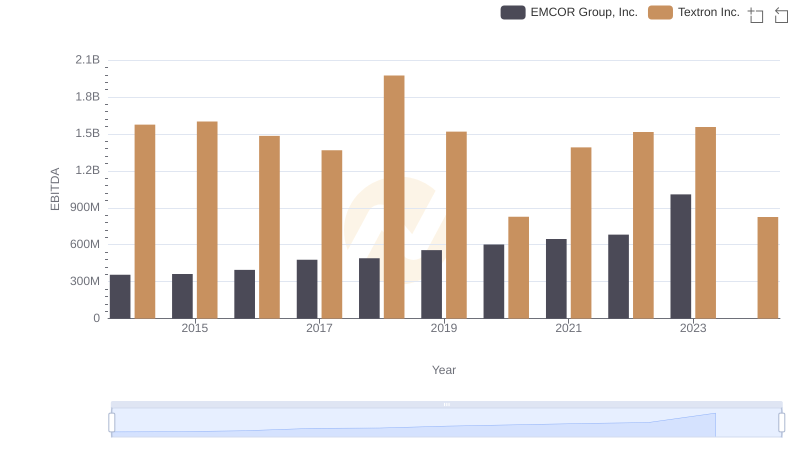
EBITDA Analysis: Evaluating EMCOR Group, Inc. Against Textron Inc.