| __timestamp | Cisco Systems, Inc. | Tyler Technologies, Inc. |
|---|---|---|
| Wednesday, January 1, 2014 | 27769000000 | 233371000 |
| Thursday, January 1, 2015 | 29681000000 | 277187000 |
| Friday, January 1, 2016 | 30960000000 | 355351000 |
| Sunday, January 1, 2017 | 30224000000 | 399140000 |
| Monday, January 1, 2018 | 30606000000 | 439578000 |
| Tuesday, January 1, 2019 | 32666000000 | 516900000 |
| Wednesday, January 1, 2020 | 31683000000 | 542512000 |
| Friday, January 1, 2021 | 31894000000 | 709644000 |
| Saturday, January 1, 2022 | 32248000000 | 783863000 |
| Sunday, January 1, 2023 | 35753000000 | 861099000 |
| Monday, January 1, 2024 | 34828000000 | 935761000 |
Data in motion
In the ever-evolving tech industry, understanding financial health is crucial. Over the past decade, Cisco Systems, Inc. has consistently demonstrated robust financial performance, with its gross profit growing by approximately 29% from 2014 to 2023. In contrast, Tyler Technologies, Inc., while smaller in scale, has shown impressive growth, with its gross profit increasing by nearly 270% over the same period. This stark difference highlights the diverse growth trajectories within the tech sector.
These insights provide a snapshot of the financial dynamics between two influential tech companies.
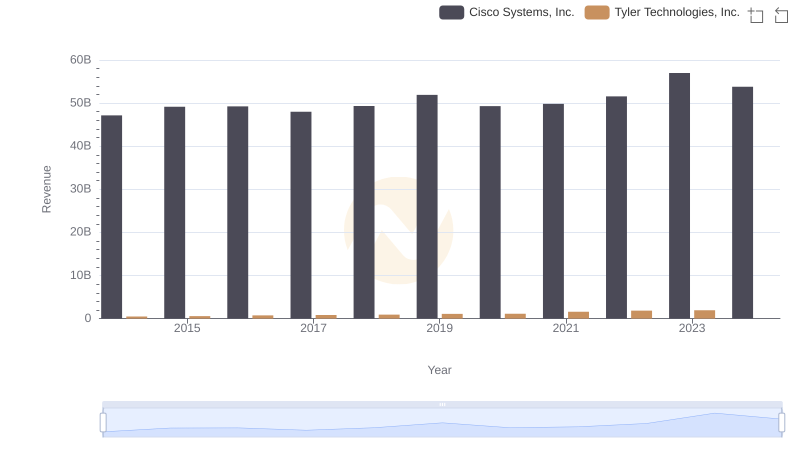
Cisco Systems, Inc. vs Tyler Technologies, Inc.: Annual Revenue Growth Compared
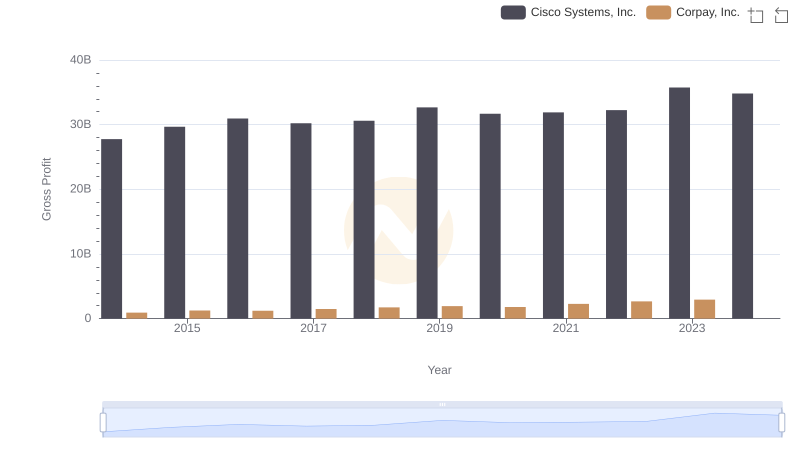
Gross Profit Comparison: Cisco Systems, Inc. and Corpay, Inc. Trends
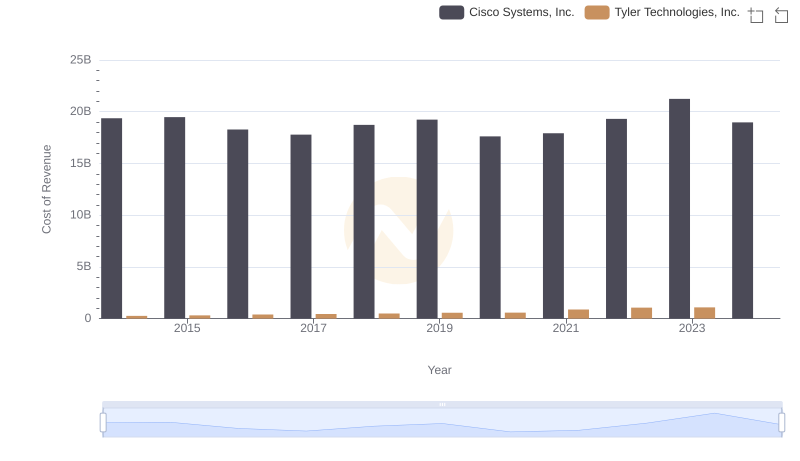
Cost of Revenue Trends: Cisco Systems, Inc. vs Tyler Technologies, Inc.
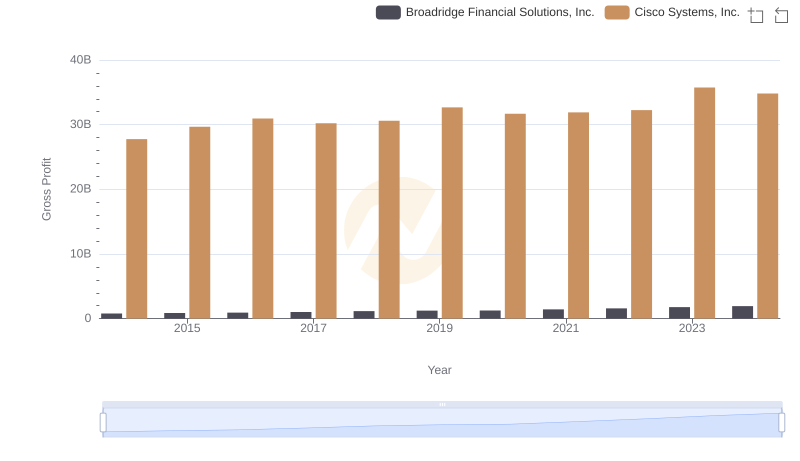
Gross Profit Comparison: Cisco Systems, Inc. and Broadridge Financial Solutions, Inc. Trends
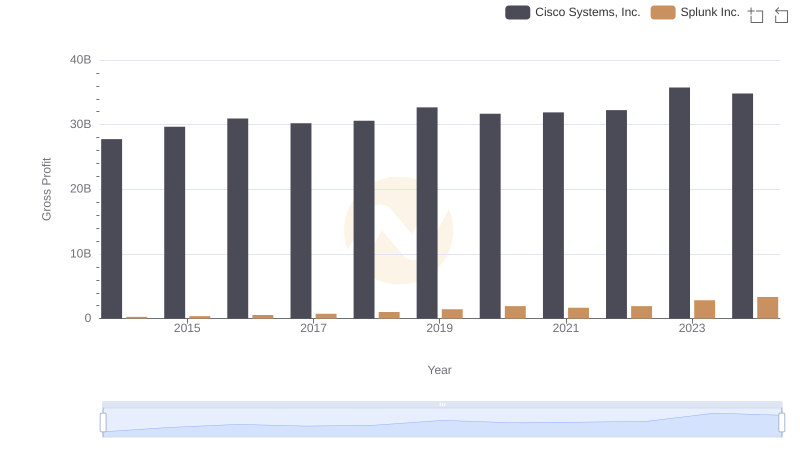
Gross Profit Comparison: Cisco Systems, Inc. and Splunk Inc. Trends
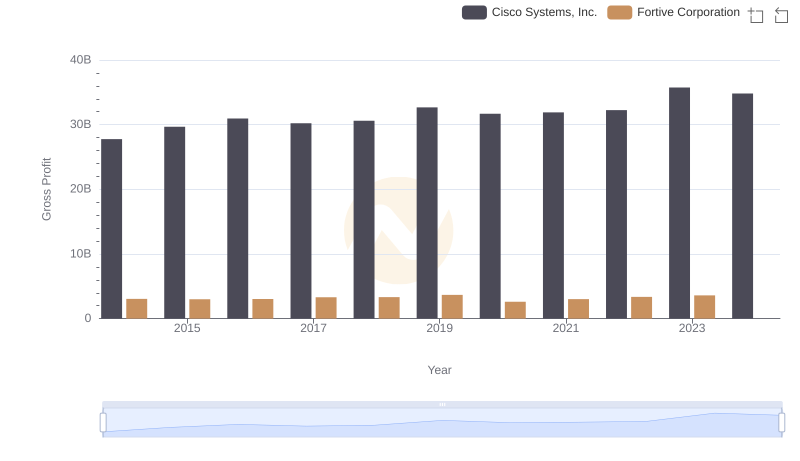
Key Insights on Gross Profit: Cisco Systems, Inc. vs Fortive Corporation
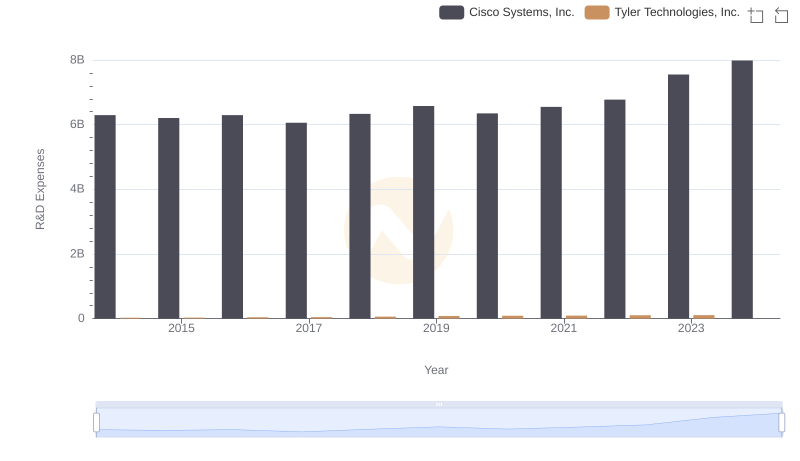
Analyzing R&D Budgets: Cisco Systems, Inc. vs Tyler Technologies, Inc.
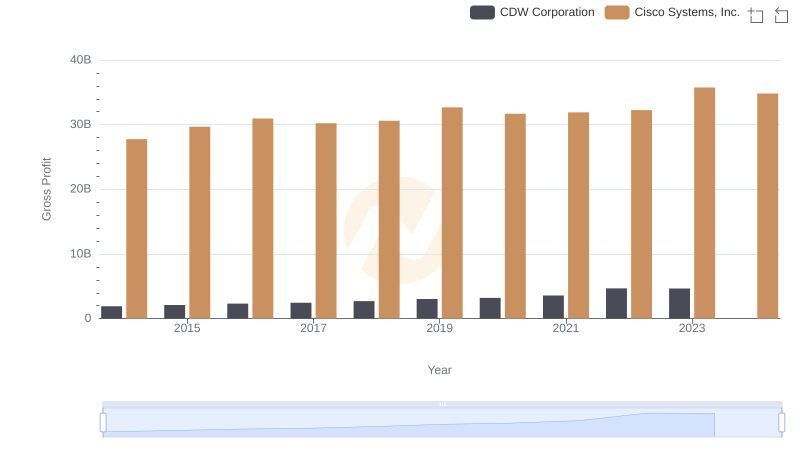
Cisco Systems, Inc. vs CDW Corporation: A Gross Profit Performance Breakdown
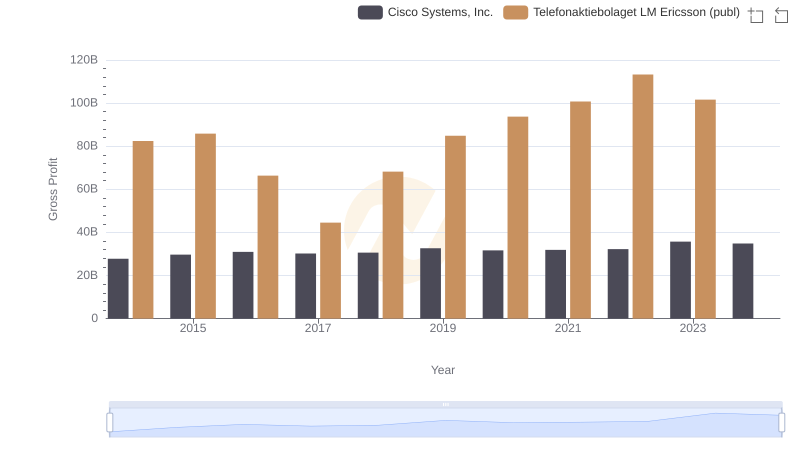
Cisco Systems, Inc. vs Telefonaktiebolaget LM Ericsson (publ): A Gross Profit Performance Breakdown
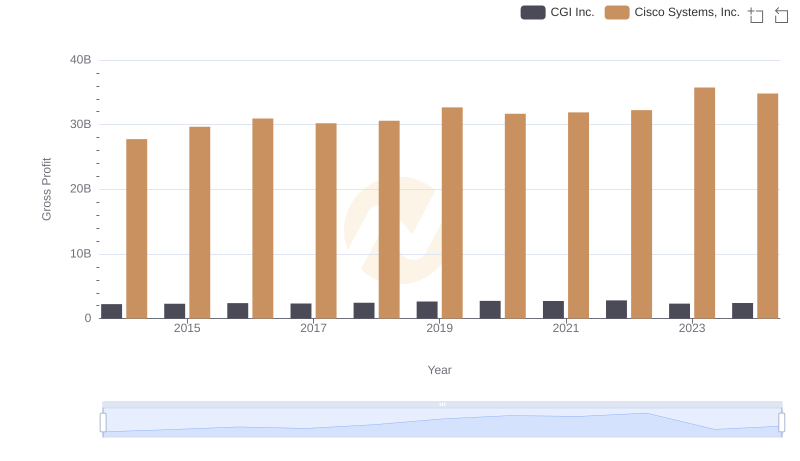
Key Insights on Gross Profit: Cisco Systems, Inc. vs CGI Inc.
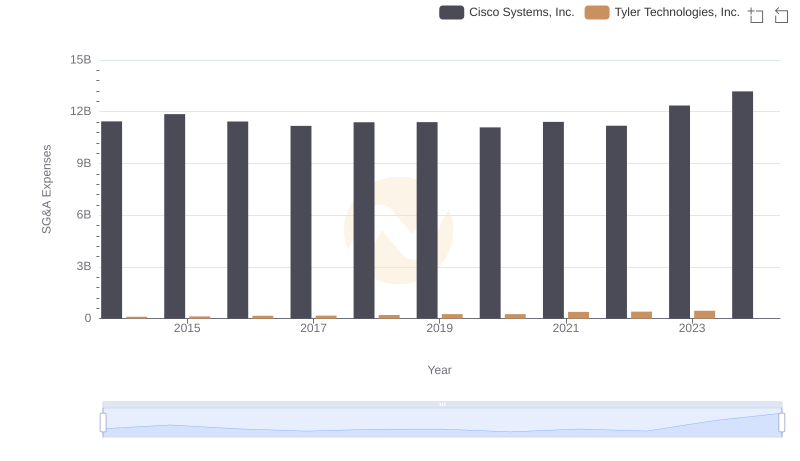
Breaking Down SG&A Expenses: Cisco Systems, Inc. vs Tyler Technologies, Inc.
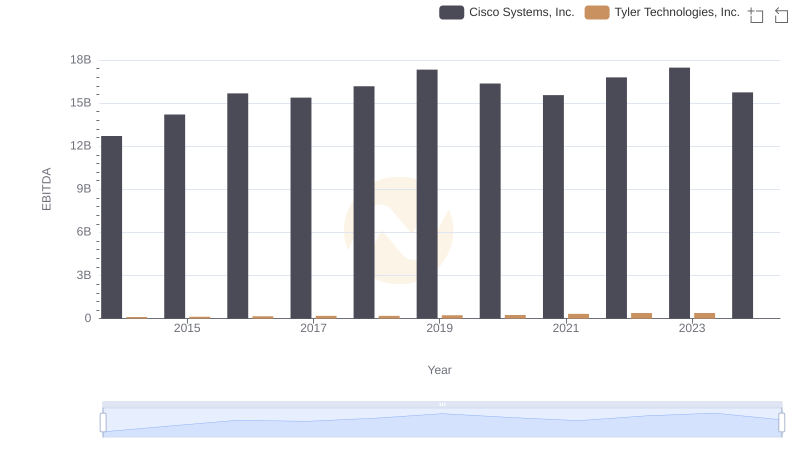
EBITDA Performance Review: Cisco Systems, Inc. vs Tyler Technologies, Inc.