| __timestamp | Broadridge Financial Solutions, Inc. | Cisco Systems, Inc. |
|---|---|---|
| Wednesday, January 1, 2014 | 796600000 | 27769000000 |
| Thursday, January 1, 2015 | 866000000 | 29681000000 |
| Friday, January 1, 2016 | 921100000 | 30960000000 |
| Sunday, January 1, 2017 | 1033000000 | 30224000000 |
| Monday, January 1, 2018 | 1160300000 | 30606000000 |
| Tuesday, January 1, 2019 | 1230300000 | 32666000000 |
| Wednesday, January 1, 2020 | 1263900000 | 31683000000 |
| Friday, January 1, 2021 | 1422900000 | 31894000000 |
| Saturday, January 1, 2022 | 1592200000 | 32248000000 |
| Sunday, January 1, 2023 | 1785400000 | 35753000000 |
| Monday, January 1, 2024 | 1933900000 | 34828000000 |
Infusing magic into the data realm
In the ever-evolving landscape of technology and financial solutions, Cisco Systems, Inc. and Broadridge Financial Solutions, Inc. have carved distinct paths. Over the past decade, Cisco's gross profit has consistently dwarfed that of Broadridge, showcasing its dominance in the tech industry. From 2014 to 2023, Cisco's gross profit surged by approximately 29%, peaking in 2023. In contrast, Broadridge, while smaller in scale, demonstrated impressive growth, with its gross profit more than doubling, reflecting a robust 142% increase over the same period.
This comparison highlights the diverse strategies and market positions of these two companies. Cisco's steady climb underscores its resilience and innovation in networking solutions, while Broadridge's rapid growth signals its expanding influence in financial technology. As we look to the future, these trends offer valuable insights into the shifting dynamics of the tech and finance sectors.
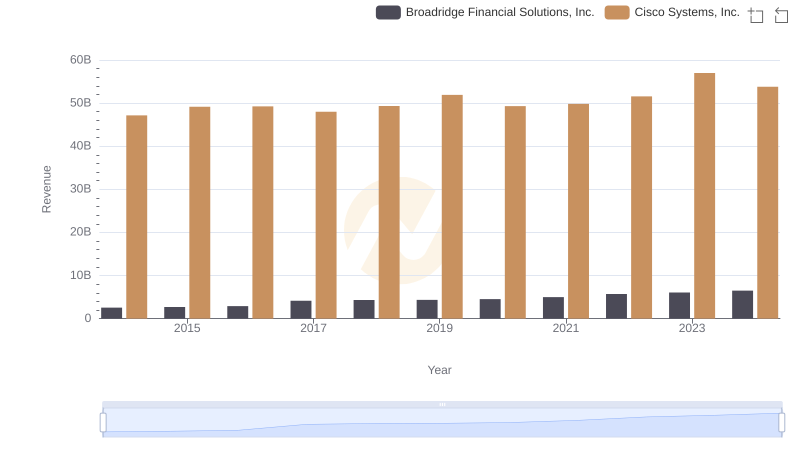
Cisco Systems, Inc. or Broadridge Financial Solutions, Inc.: Who Leads in Yearly Revenue?
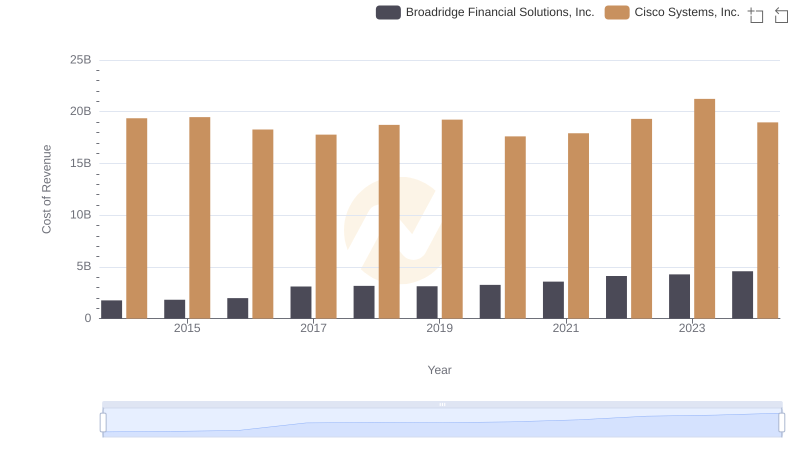
Analyzing Cost of Revenue: Cisco Systems, Inc. and Broadridge Financial Solutions, Inc.

Gross Profit Analysis: Comparing Cisco Systems, Inc. and Keysight Technologies, Inc.
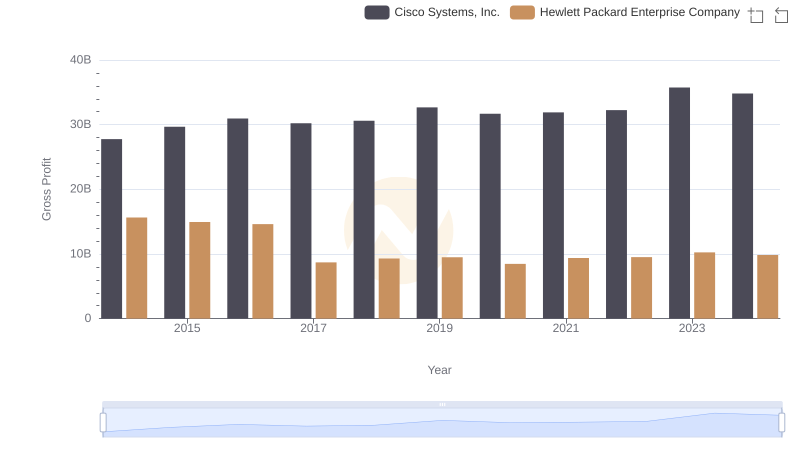
Key Insights on Gross Profit: Cisco Systems, Inc. vs Hewlett Packard Enterprise Company
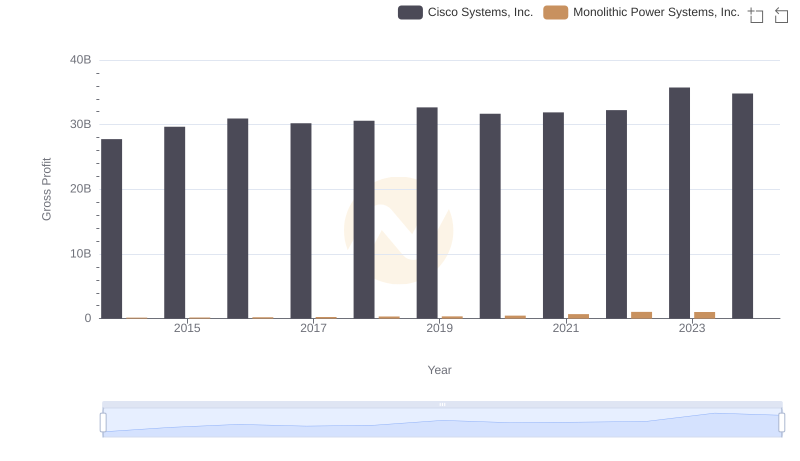
Key Insights on Gross Profit: Cisco Systems, Inc. vs Monolithic Power Systems, Inc.

Gross Profit Analysis: Comparing Cisco Systems, Inc. and II-VI Incorporated
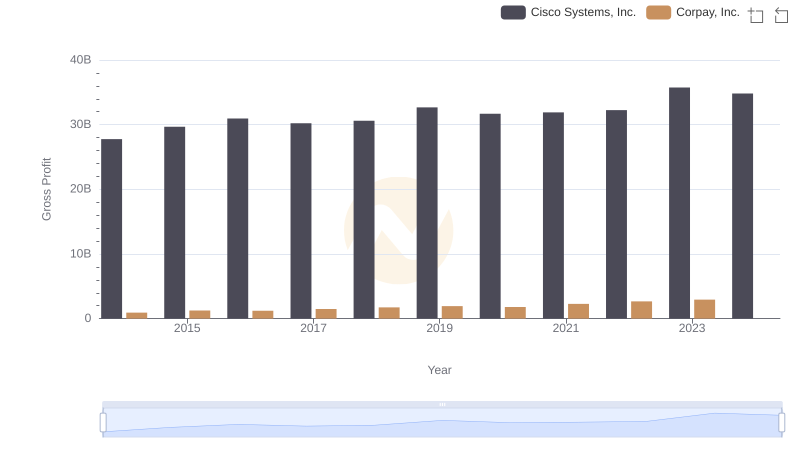
Gross Profit Comparison: Cisco Systems, Inc. and Corpay, Inc. Trends
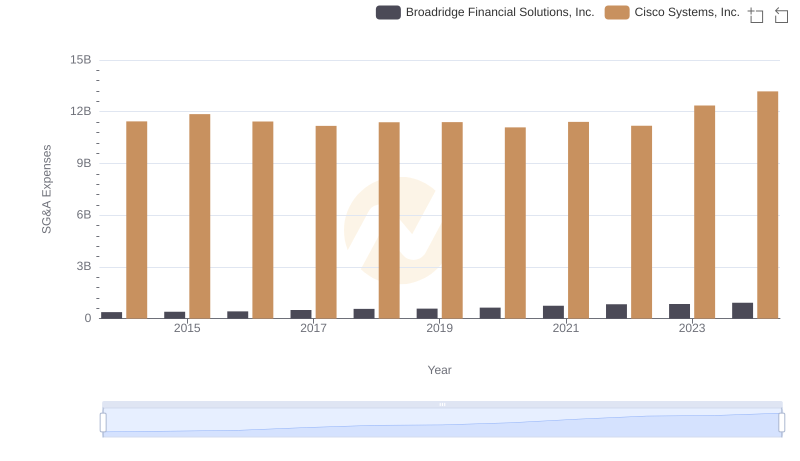
Breaking Down SG&A Expenses: Cisco Systems, Inc. vs Broadridge Financial Solutions, Inc.
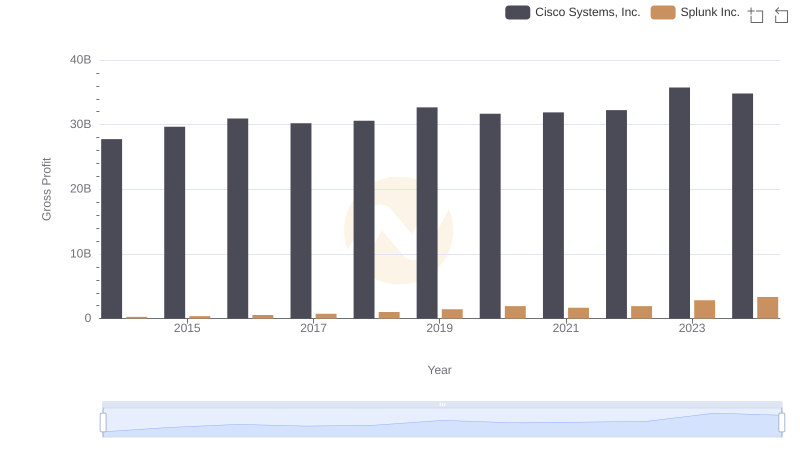
Gross Profit Comparison: Cisco Systems, Inc. and Splunk Inc. Trends

Gross Profit Analysis: Comparing Cisco Systems, Inc. and Tyler Technologies, Inc.
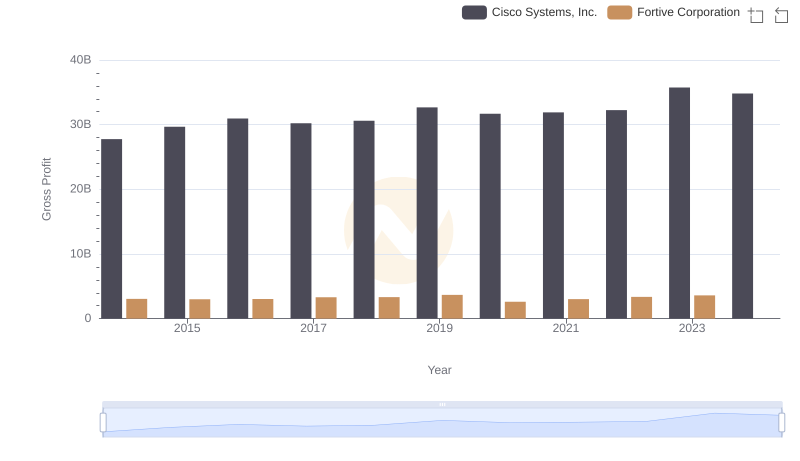
Key Insights on Gross Profit: Cisco Systems, Inc. vs Fortive Corporation
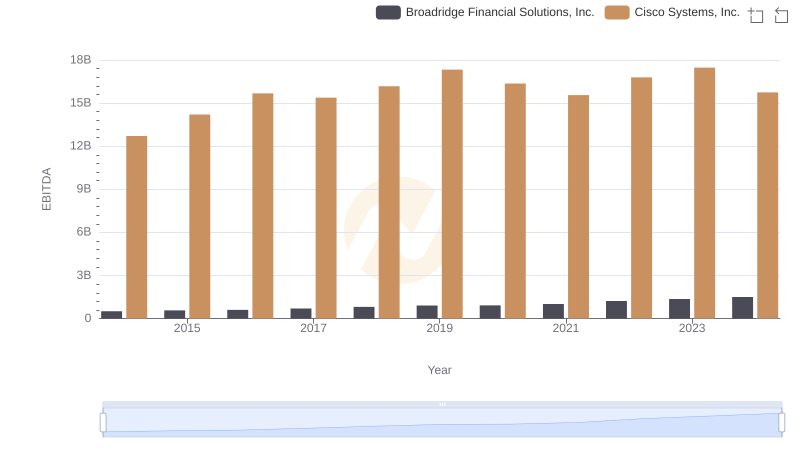
EBITDA Metrics Evaluated: Cisco Systems, Inc. vs Broadridge Financial Solutions, Inc.