| __timestamp | Axon Enterprise, Inc. | Stanley Black & Decker, Inc. |
|---|---|---|
| Wednesday, January 1, 2014 | 101548000 | 4102700000 |
| Thursday, January 1, 2015 | 128647000 | 4072000000 |
| Friday, January 1, 2016 | 170536000 | 4267200000 |
| Sunday, January 1, 2017 | 207088000 | 4778000000 |
| Monday, January 1, 2018 | 258583000 | 4901900000 |
| Tuesday, January 1, 2019 | 307286000 | 4805500000 |
| Wednesday, January 1, 2020 | 416331000 | 4967900000 |
| Friday, January 1, 2021 | 540910000 | 5194200000 |
| Saturday, January 1, 2022 | 728638000 | 4284100000 |
| Sunday, January 1, 2023 | 955382000 | 4098000000 |
| Monday, January 1, 2024 | 4514400000 |
Unleashing the power of data
In the ever-evolving landscape of corporate profitability, Axon Enterprise, Inc. and Stanley Black & Decker, Inc. present a fascinating study in contrasts. Over the past decade, Axon has demonstrated a remarkable growth trajectory, with its gross profit surging by over 840% from 2014 to 2023. This growth is a testament to Axon's strategic innovations and market expansion.
Conversely, Stanley Black & Decker, a stalwart in the industry, has maintained a steady gross profit, peaking in 2021. Despite a slight decline in recent years, its gross profit remains robust, underscoring its resilience and established market presence.
This analysis not only highlights the dynamic nature of business growth but also underscores the importance of strategic adaptability in maintaining profitability. As we look to the future, these trends offer valuable insights into the strategies that drive success in the corporate world.
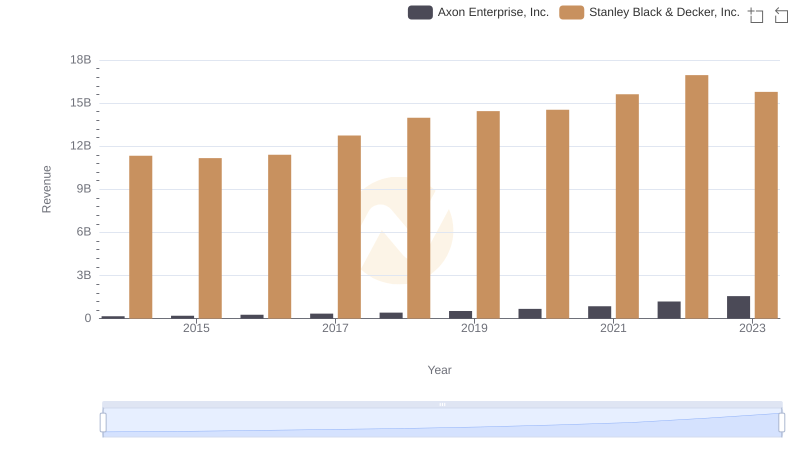
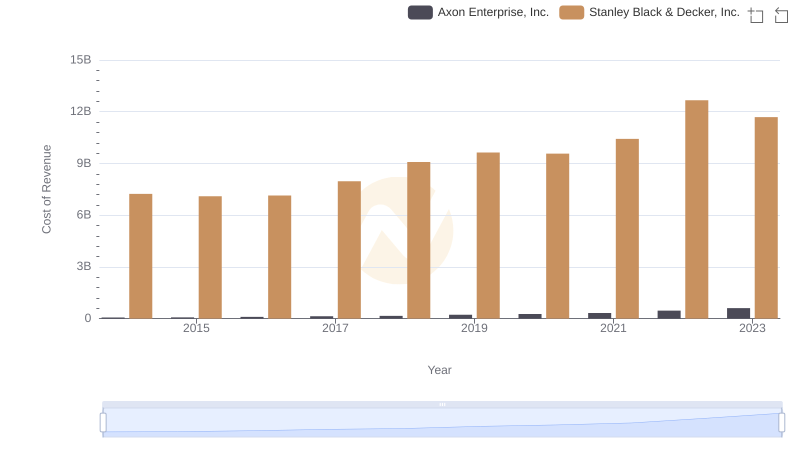
Revenue Showdown: Axon Enterprise, Inc. vs Stanley Black & Decker, Inc.

Cost of Revenue Trends: Axon Enterprise, Inc. vs Stanley Black & Decker, Inc.
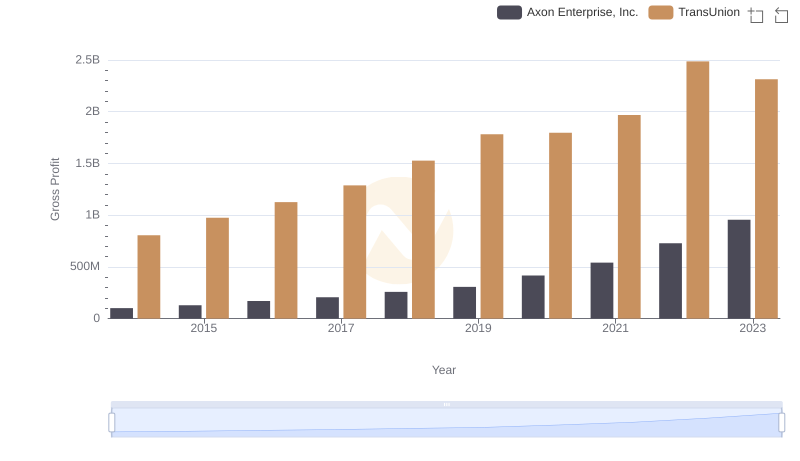
Gross Profit Comparison: Axon Enterprise, Inc. and TransUnion Trends
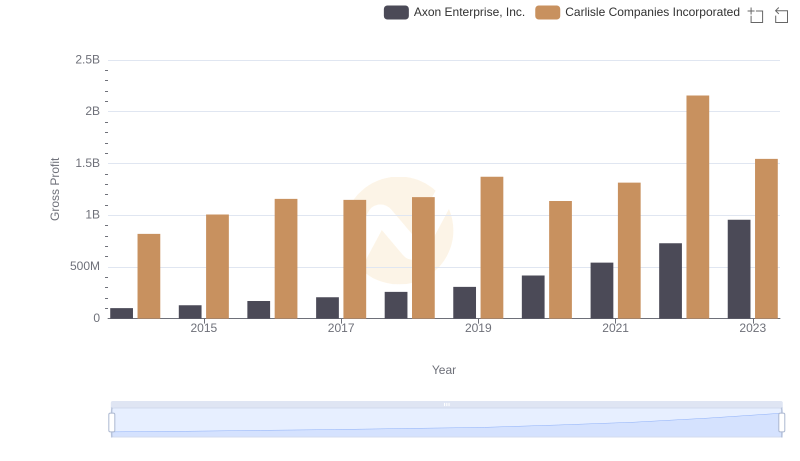
Gross Profit Trends Compared: Axon Enterprise, Inc. vs Carlisle Companies Incorporated
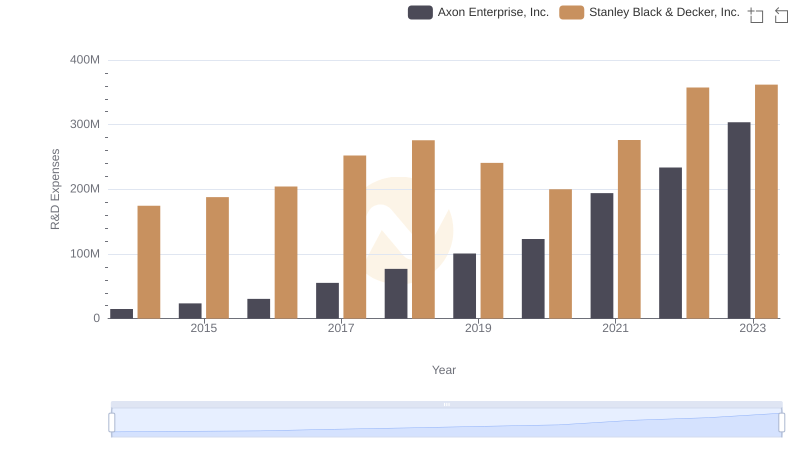
Who Prioritizes Innovation? R&D Spending Compared for Axon Enterprise, Inc. and Stanley Black & Decker, Inc.
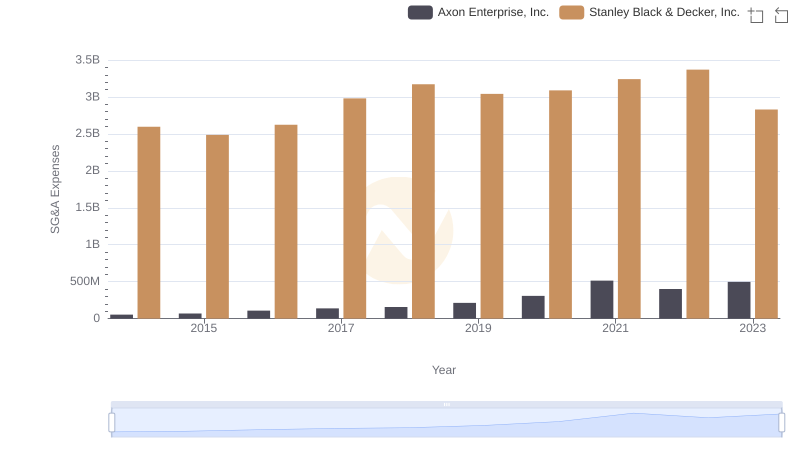
SG&A Efficiency Analysis: Comparing Axon Enterprise, Inc. and Stanley Black & Decker, Inc.
Cost Insights: Breaking Down Axon Enterprise, Inc. and Stanley Black & Decker, Inc.'s Expenses
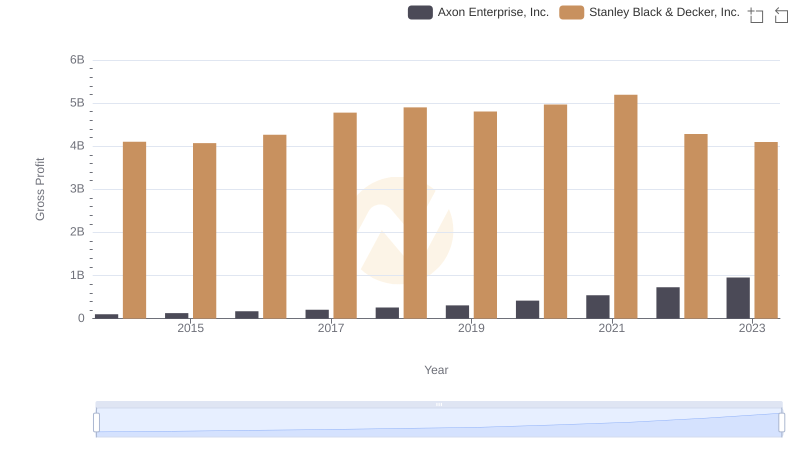
Who Generates Higher Gross Profit? Axon Enterprise, Inc. or Stanley Black & Decker, Inc.

Research and Development Expenses Breakdown: Axon Enterprise, Inc. vs Stanley Black & Decker, Inc.

Axon Enterprise, Inc. vs Stanley Black & Decker, Inc.: SG&A Expense Trends