| __timestamp | Axon Enterprise, Inc. | Lennox International Inc. |
|---|---|---|
| Wednesday, January 1, 2014 | 101548000 | 903300000 |
| Thursday, January 1, 2015 | 128647000 | 947400000 |
| Friday, January 1, 2016 | 170536000 | 1076500000 |
| Sunday, January 1, 2017 | 207088000 | 1125200000 |
| Monday, January 1, 2018 | 258583000 | 1111200000 |
| Tuesday, January 1, 2019 | 307286000 | 1079800000 |
| Wednesday, January 1, 2020 | 416331000 | 1040100000 |
| Friday, January 1, 2021 | 540910000 | 1188400000 |
| Saturday, January 1, 2022 | 728638000 | 1284700000 |
| Sunday, January 1, 2023 | 955382000 | 1547800000 |
| Monday, January 1, 2024 | 1771900000 |
Data in motion
In the ever-evolving landscape of American industry, Axon Enterprise, Inc. and Lennox International Inc. have showcased intriguing trajectories in their gross profit margins over the past decade. From 2014 to 2023, Axon Enterprise has seen a remarkable growth, with its gross profit surging by over 840%, from approximately $101 million to nearly $956 million. This growth reflects Axon's strategic innovations and market expansion.
Conversely, Lennox International, a stalwart in the HVAC industry, has demonstrated steady growth, with its gross profit increasing by about 71% during the same period, reaching approximately $1.55 billion in 2023. This consistent performance underscores Lennox's resilience and market leadership.
While Axon's data for 2024 is missing, Lennox continues its upward trend, projecting a gross profit of $1.77 billion. These insights highlight the dynamic nature of these companies and their respective industries.

Revenue Insights: Axon Enterprise, Inc. and Lennox International Inc. Performance Compared
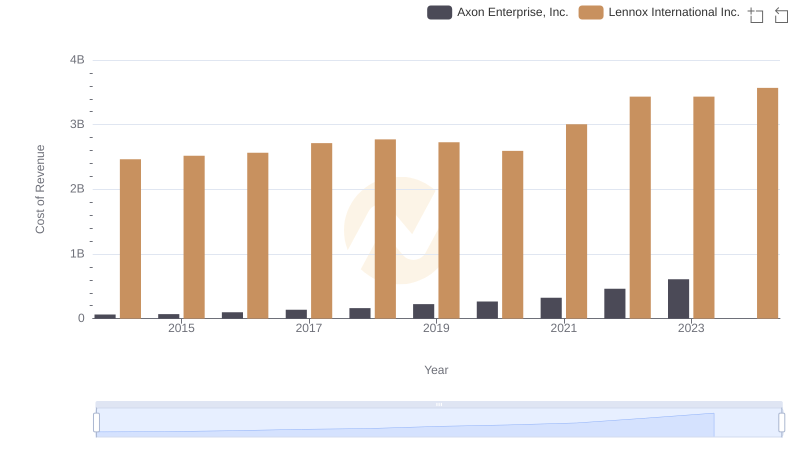
Cost of Revenue Trends: Axon Enterprise, Inc. vs Lennox International Inc.
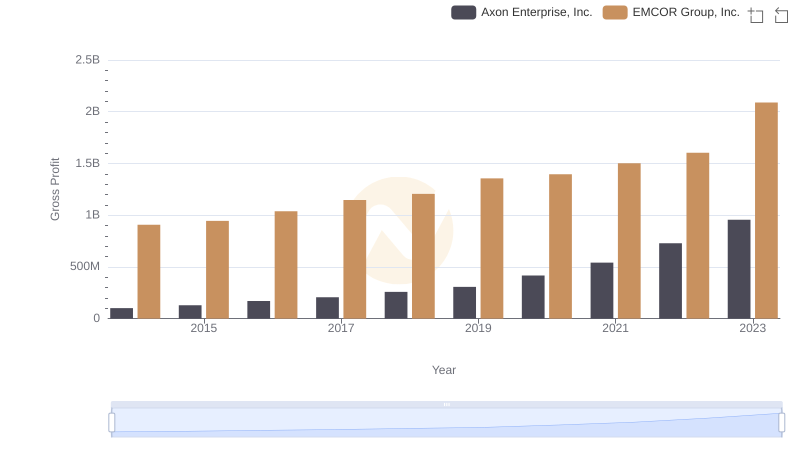
Key Insights on Gross Profit: Axon Enterprise, Inc. vs EMCOR Group, Inc.
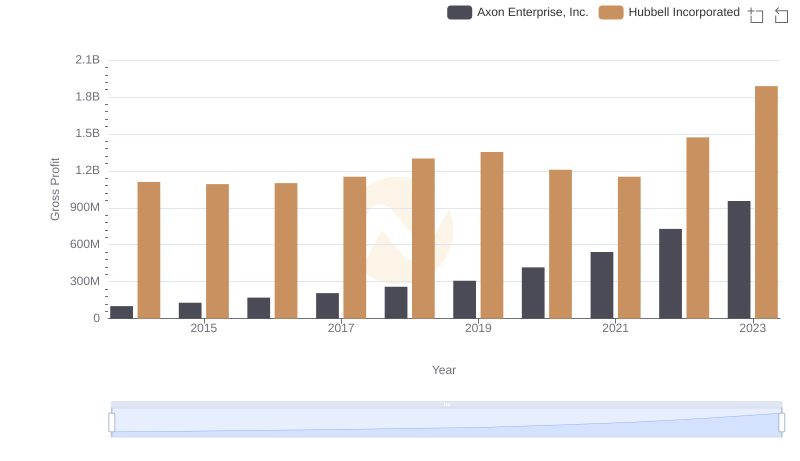
Key Insights on Gross Profit: Axon Enterprise, Inc. vs Hubbell Incorporated
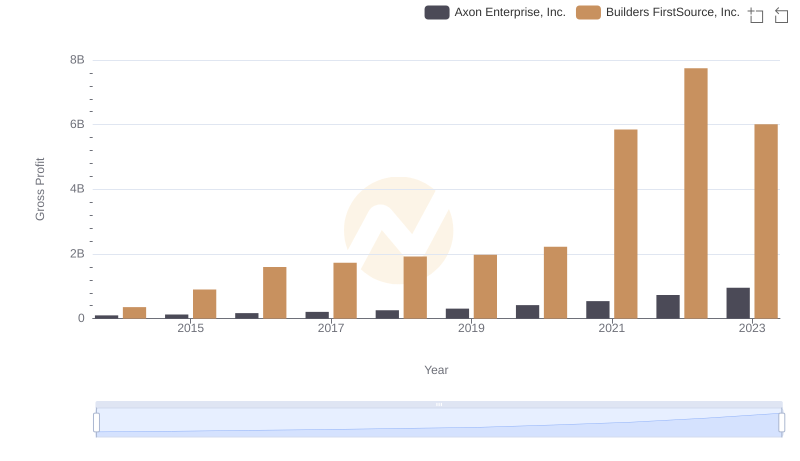
Gross Profit Trends Compared: Axon Enterprise, Inc. vs Builders FirstSource, Inc.
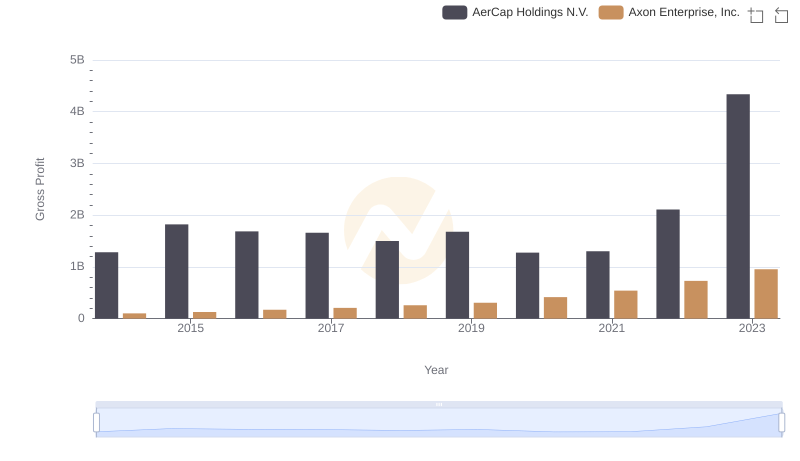
Key Insights on Gross Profit: Axon Enterprise, Inc. vs AerCap Holdings N.V.
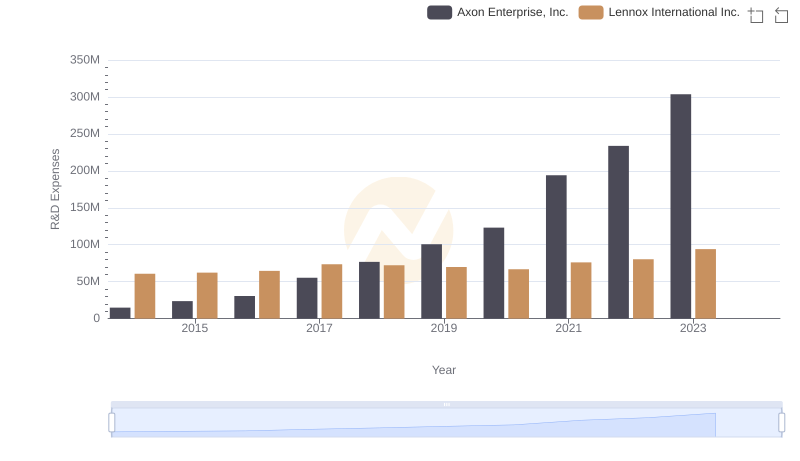
Who Prioritizes Innovation? R&D Spending Compared for Axon Enterprise, Inc. and Lennox International Inc.
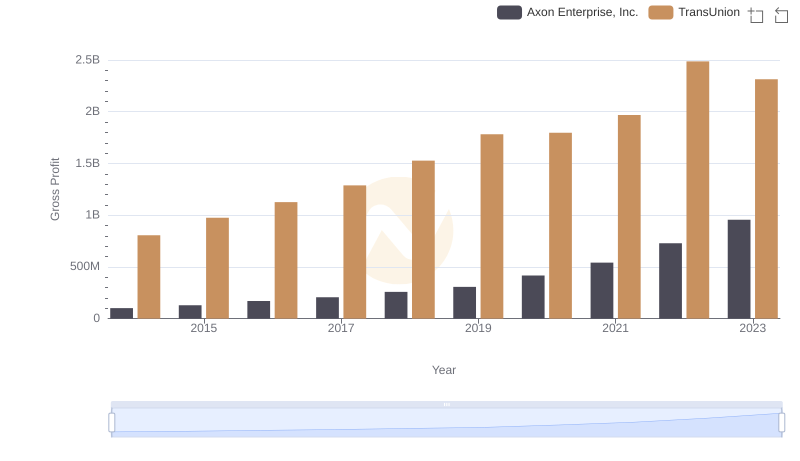
Gross Profit Comparison: Axon Enterprise, Inc. and TransUnion Trends
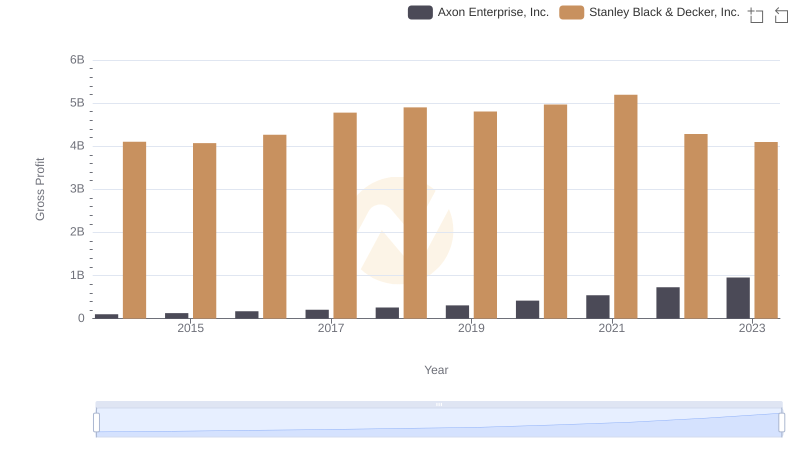
Axon Enterprise, Inc. and Stanley Black & Decker, Inc.: A Detailed Gross Profit Analysis
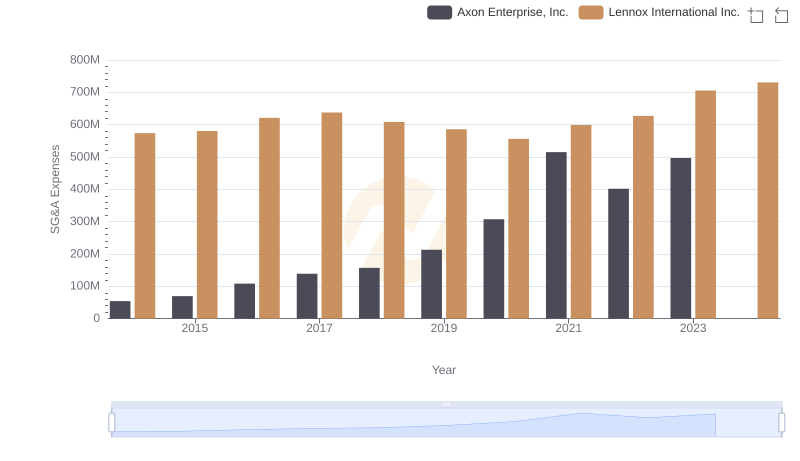
Axon Enterprise, Inc. and Lennox International Inc.: SG&A Spending Patterns Compared