| __timestamp | Nordson Corporation | United Rentals, Inc. |
|---|---|---|
| Wednesday, January 1, 2014 | 945098000 | 2432000000 |
| Thursday, January 1, 2015 | 913964000 | 2480000000 |
| Friday, January 1, 2016 | 993499000 | 2403000000 |
| Sunday, January 1, 2017 | 1139001000 | 2769000000 |
| Monday, January 1, 2018 | 1235965000 | 3364000000 |
| Tuesday, January 1, 2019 | 1192103000 | 3670000000 |
| Wednesday, January 1, 2020 | 1130468000 | 3183000000 |
| Friday, January 1, 2021 | 1324080000 | 3853000000 |
| Saturday, January 1, 2022 | 1426536000 | 4996000000 |
| Sunday, January 1, 2023 | 1425405000 | 5813000000 |
| Monday, January 1, 2024 | 1486129000 | 6150000000 |
Unleashing insights
In the ever-evolving landscape of industrial giants, United Rentals, Inc. and Nordson Corporation have showcased remarkable financial trajectories over the past decade. From 2014 to 2024, United Rentals, Inc. has seen its gross profit soar by approximately 153%, reflecting its robust growth strategy and market adaptability. In contrast, Nordson Corporation, while experiencing a steady increase, has achieved a 57% rise in gross profit during the same period.
These trends highlight the dynamic nature of the industrial sector, where strategic investments and market positioning play pivotal roles in financial success.
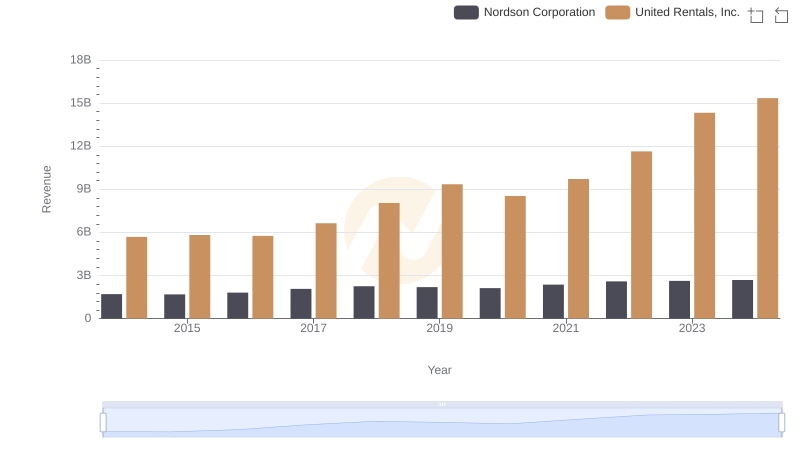
Revenue Showdown: United Rentals, Inc. vs Nordson Corporation
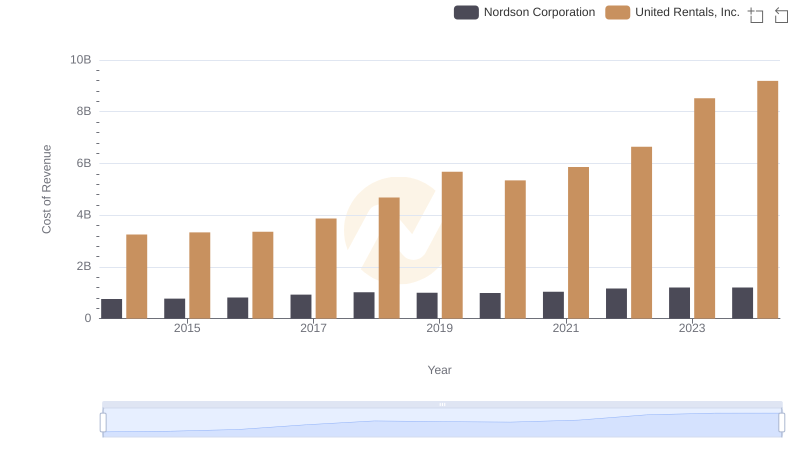
Comparing Cost of Revenue Efficiency: United Rentals, Inc. vs Nordson Corporation
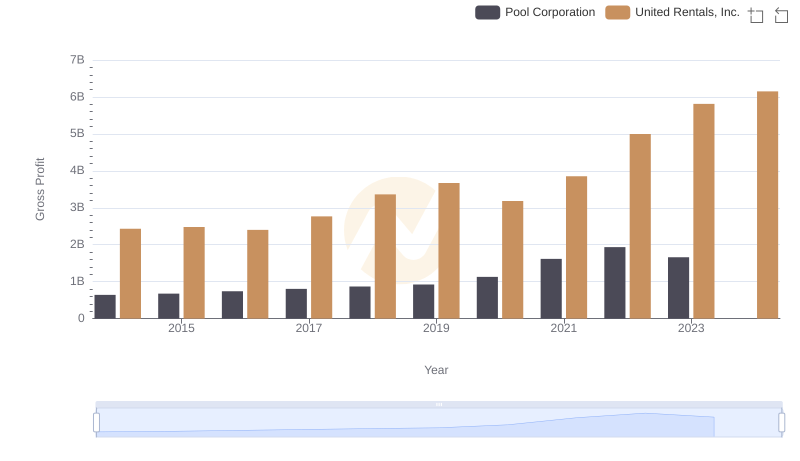
United Rentals, Inc. vs Pool Corporation: A Gross Profit Performance Breakdown

Gross Profit Comparison: United Rentals, Inc. and U-Haul Holding Company Trends
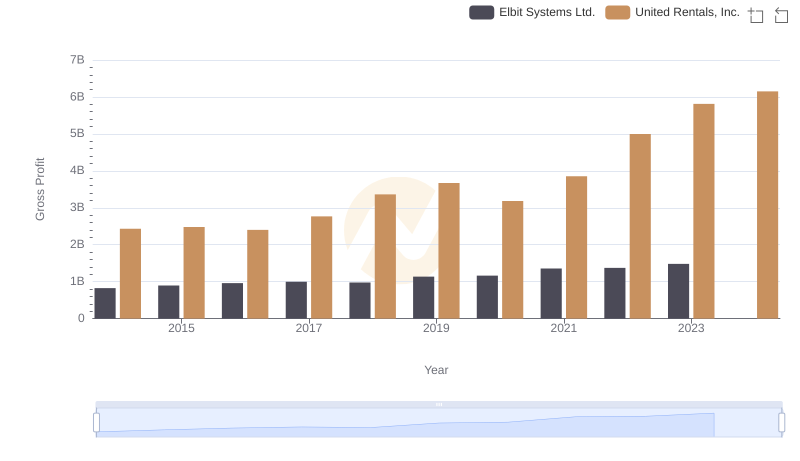
Gross Profit Analysis: Comparing United Rentals, Inc. and Elbit Systems Ltd.

Gross Profit Trends Compared: United Rentals, Inc. vs C.H. Robinson Worldwide, Inc.
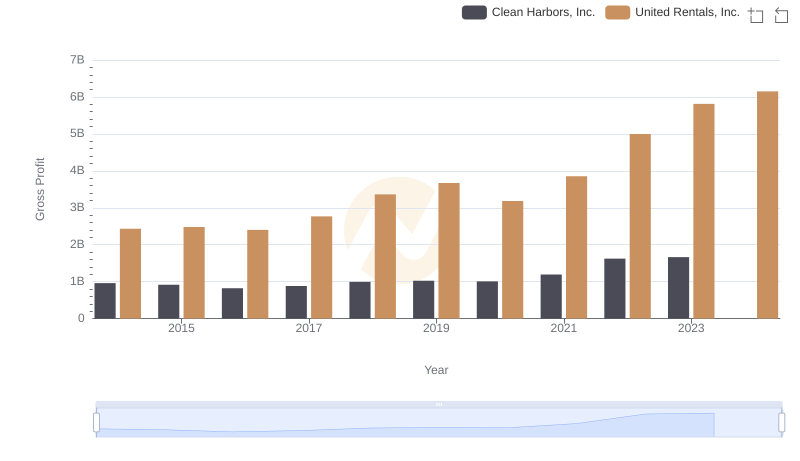
United Rentals, Inc. and Clean Harbors, Inc.: A Detailed Gross Profit Analysis

United Rentals, Inc. and Curtiss-Wright Corporation: A Detailed Gross Profit Analysis
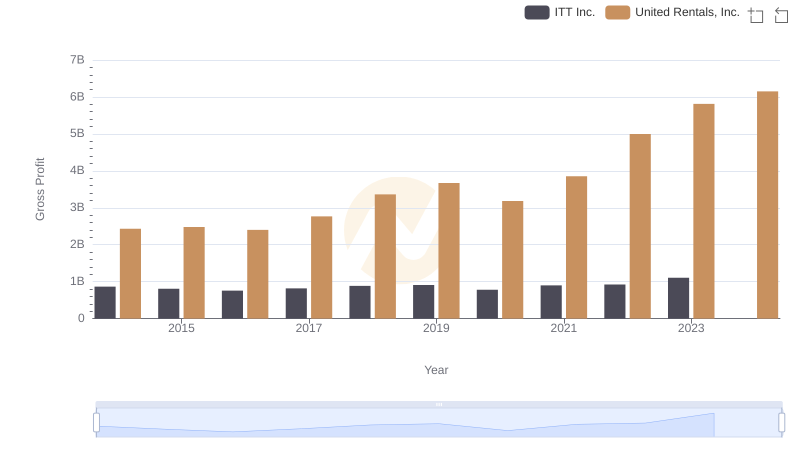
Who Generates Higher Gross Profit? United Rentals, Inc. or ITT Inc.
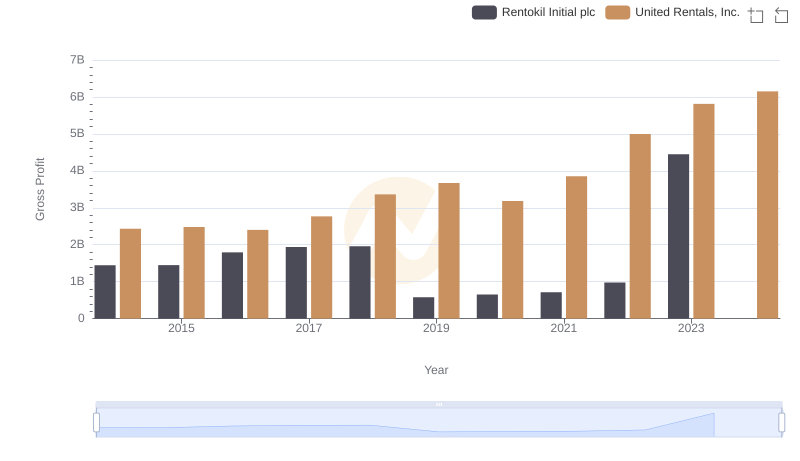
Who Generates Higher Gross Profit? United Rentals, Inc. or Rentokil Initial plc
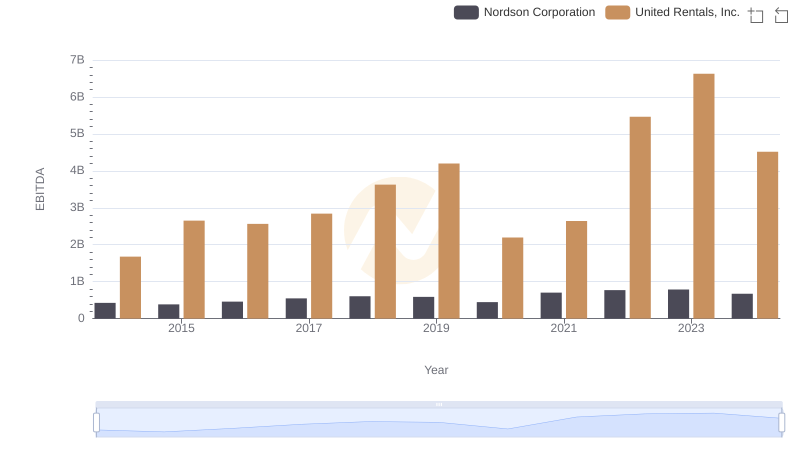
Comprehensive EBITDA Comparison: United Rentals, Inc. vs Nordson Corporation