| __timestamp | Owens Corning | Trane Technologies plc |
|---|---|---|
| Wednesday, January 1, 2014 | 976000000 | 3908600000 |
| Thursday, January 1, 2015 | 1153000000 | 3999100000 |
| Friday, January 1, 2016 | 1381000000 | 4179600000 |
| Sunday, January 1, 2017 | 1572000000 | 4386000000 |
| Monday, January 1, 2018 | 1632000000 | 4820600000 |
| Tuesday, January 1, 2019 | 1609000000 | 5147400000 |
| Wednesday, January 1, 2020 | 1610000000 | 3803400000 |
| Friday, January 1, 2021 | 2217000000 | 4469600000 |
| Saturday, January 1, 2022 | 2616000000 | 4964800000 |
| Sunday, January 1, 2023 | 2683000000 | 5857200000 |
| Monday, January 1, 2024 | 7080500000 |
Unveiling the hidden dimensions of data
In the competitive landscape of industrial manufacturing, Trane Technologies plc and Owens Corning have showcased remarkable growth in gross profit over the past decade. From 2014 to 2023, Trane Technologies plc has consistently outperformed Owens Corning, with an average gross profit nearly 2.6 times higher. Notably, Trane Technologies plc's gross profit surged by approximately 50% from 2014 to 2023, peaking in 2023 with a 5.86 billion mark. Meanwhile, Owens Corning demonstrated a robust growth trajectory, achieving a 175% increase in gross profit over the same period, culminating in a 2.68 billion figure in 2023. This analysis highlights the resilience and strategic prowess of these industry leaders, as they navigate economic fluctuations and market demands. As we look to the future, these trends underscore the importance of innovation and efficiency in sustaining financial growth.
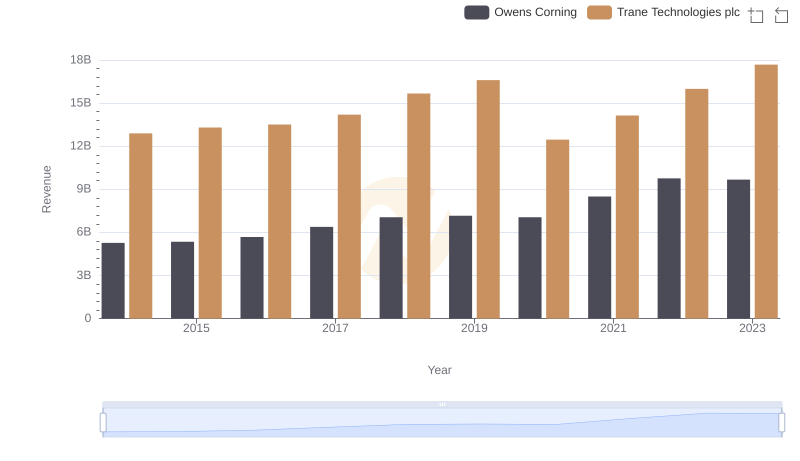
Trane Technologies plc vs Owens Corning: Annual Revenue Growth Compared
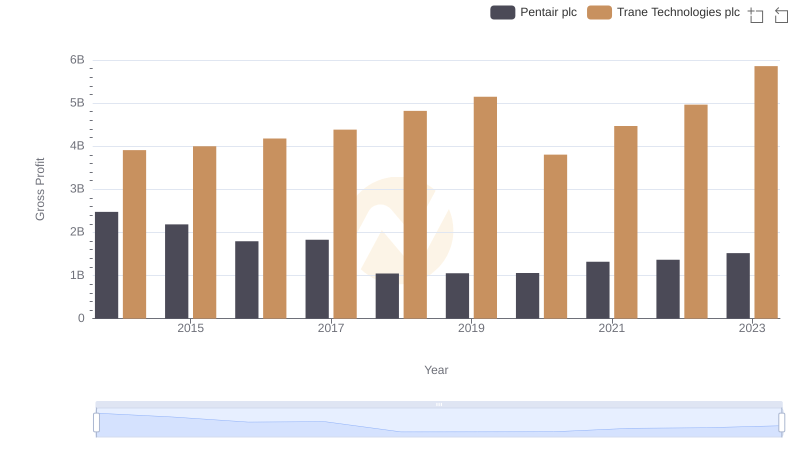
Trane Technologies plc and Pentair plc: A Detailed Gross Profit Analysis
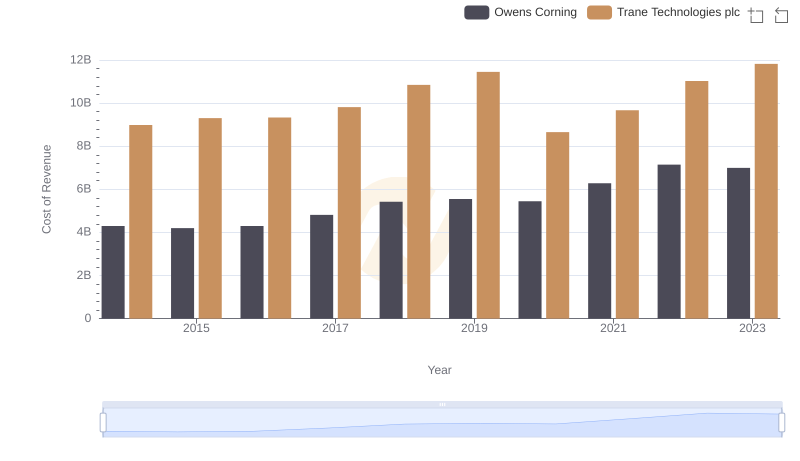
Cost Insights: Breaking Down Trane Technologies plc and Owens Corning's Expenses
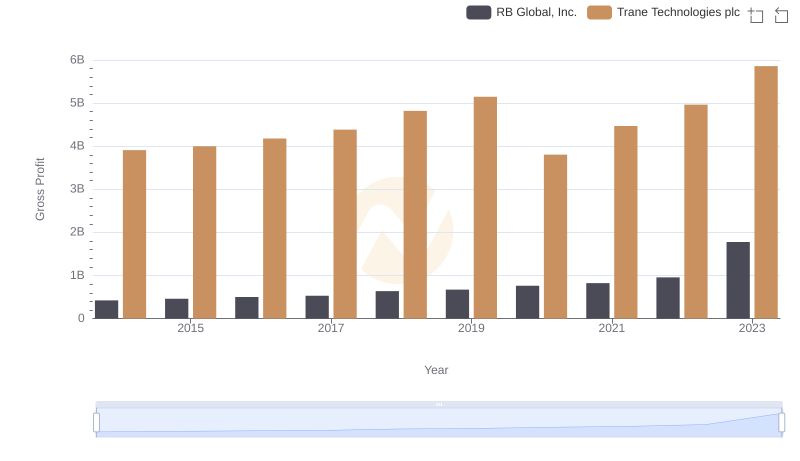
Who Generates Higher Gross Profit? Trane Technologies plc or RB Global, Inc.
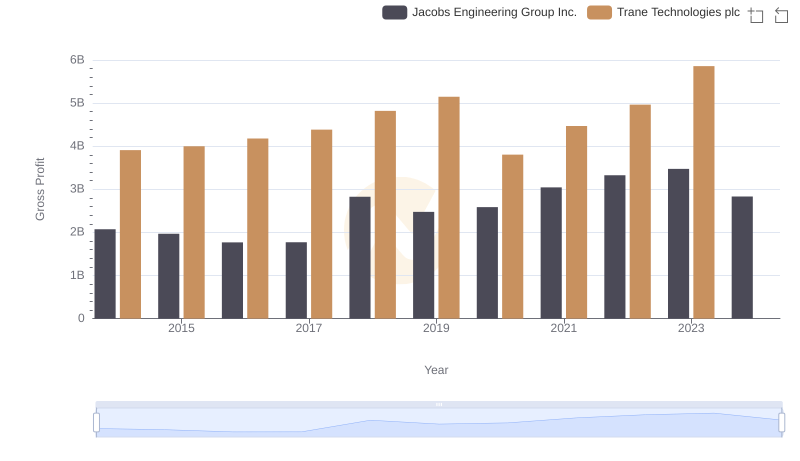
Who Generates Higher Gross Profit? Trane Technologies plc or Jacobs Engineering Group Inc.
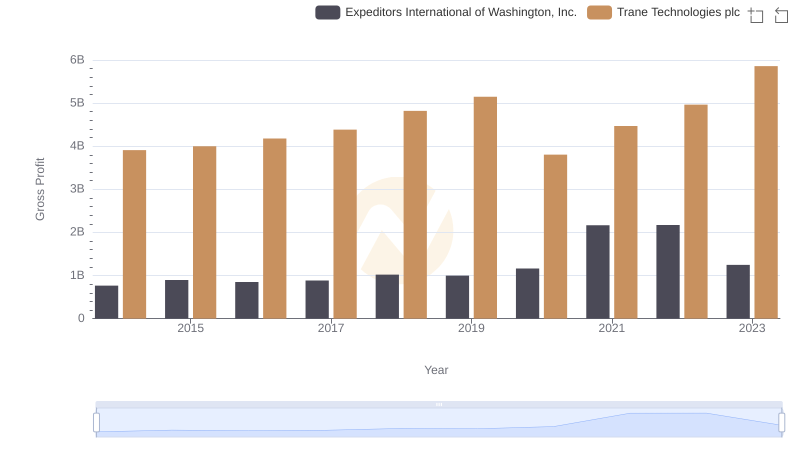
Trane Technologies plc vs Expeditors International of Washington, Inc.: A Gross Profit Performance Breakdown
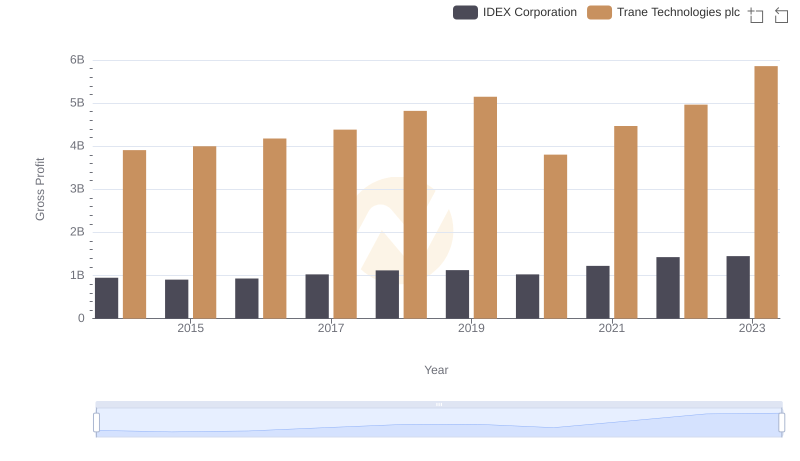
Trane Technologies plc vs IDEX Corporation: A Gross Profit Performance Breakdown
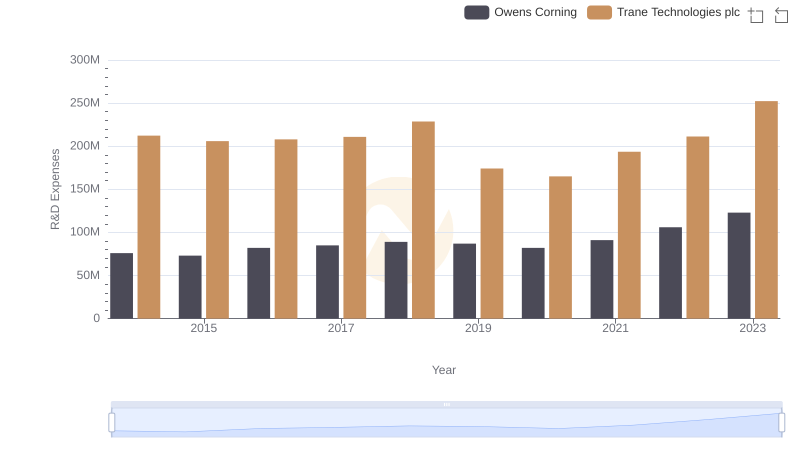
Trane Technologies plc vs Owens Corning: Strategic Focus on R&D Spending
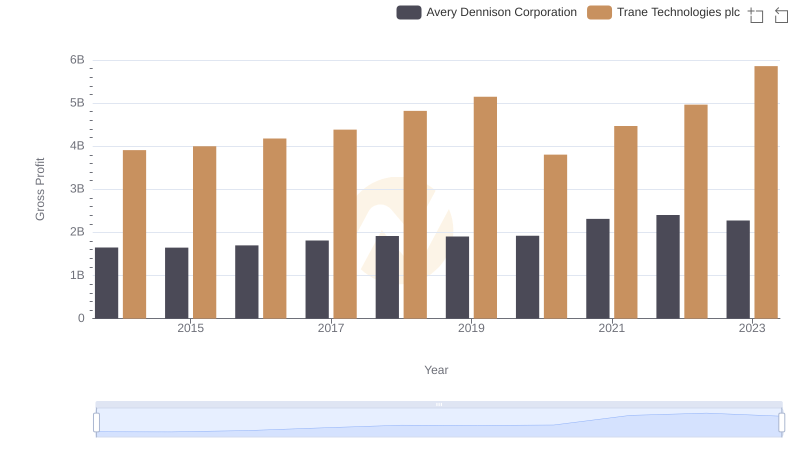
Trane Technologies plc vs Avery Dennison Corporation: A Gross Profit Performance Breakdown
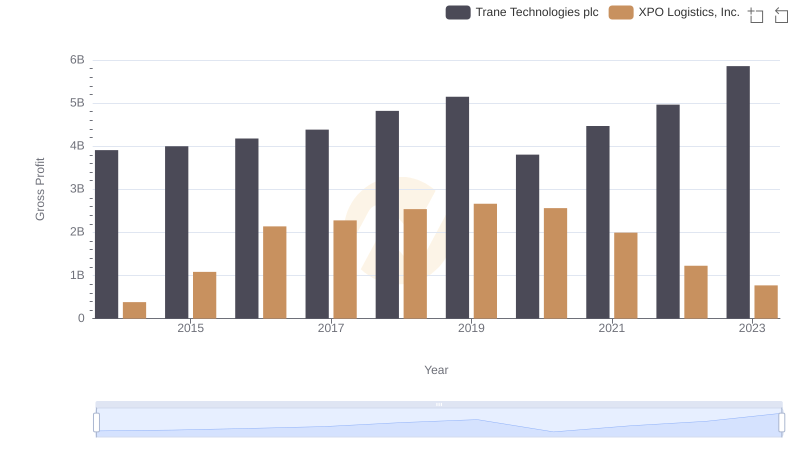
Key Insights on Gross Profit: Trane Technologies plc vs XPO Logistics, Inc.
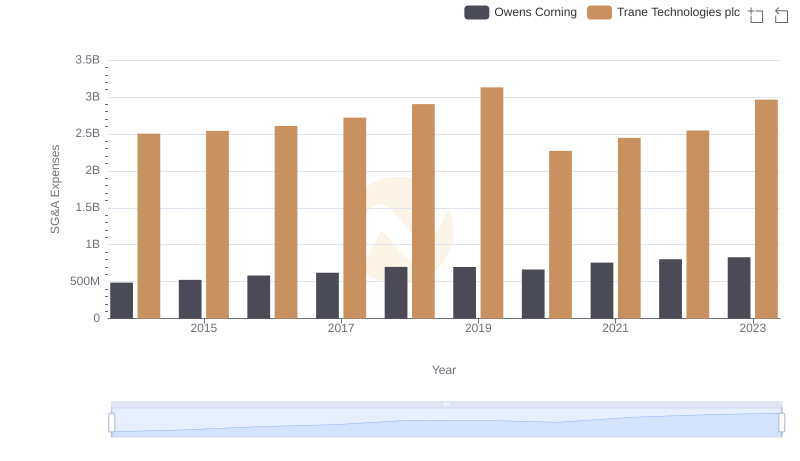
Trane Technologies plc or Owens Corning: Who Manages SG&A Costs Better?
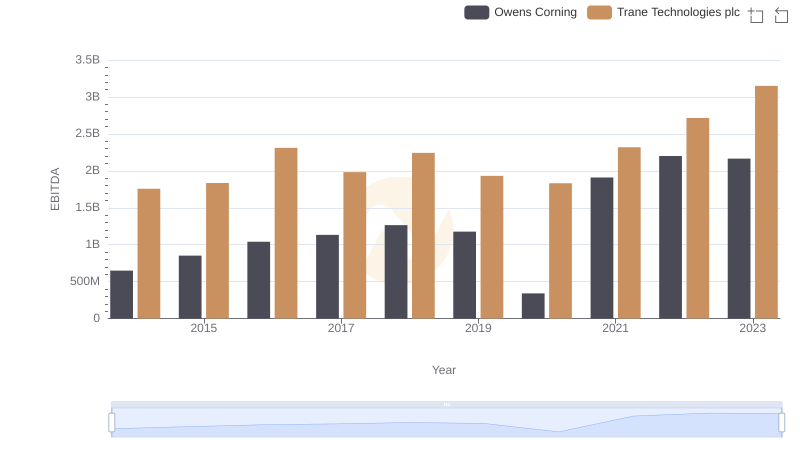
A Professional Review of EBITDA: Trane Technologies plc Compared to Owens Corning