| __timestamp | Jacobs Engineering Group Inc. | Trane Technologies plc |
|---|---|---|
| Wednesday, January 1, 2014 | 2073784000 | 3908600000 |
| Thursday, January 1, 2015 | 1968338000 | 3999100000 |
| Friday, January 1, 2016 | 1767831000 | 4179600000 |
| Sunday, January 1, 2017 | 1772252000 | 4386000000 |
| Monday, January 1, 2018 | 2828370000 | 4820600000 |
| Tuesday, January 1, 2019 | 2477028000 | 5147400000 |
| Wednesday, January 1, 2020 | 2586668000 | 3803400000 |
| Friday, January 1, 2021 | 3043772000 | 4469600000 |
| Saturday, January 1, 2022 | 3327040000 | 4964800000 |
| Sunday, January 1, 2023 | 3473315000 | 5857200000 |
| Monday, January 1, 2024 | 2832756000 | 7080500000 |
Unlocking the unknown
In the competitive landscape of industrial giants, Trane Technologies plc and Jacobs Engineering Group Inc. have been pivotal players. Over the past decade, Trane Technologies has consistently outperformed Jacobs Engineering in terms of gross profit. From 2014 to 2023, Trane Technologies maintained an average gross profit that was approximately 78% higher than Jacobs Engineering. Notably, in 2023, Trane Technologies achieved a gross profit of nearly $5.86 billion, marking a significant lead over Jacobs Engineering's $3.47 billion.
Trane Technologies' gross profit saw a steady increase, peaking in 2023, while Jacobs Engineering experienced more fluctuations. The data highlights Trane Technologies' robust growth strategy and market positioning. However, the data for 2024 is incomplete, leaving room for speculation on future trends. This analysis underscores the importance of strategic planning and market adaptation in achieving financial success.
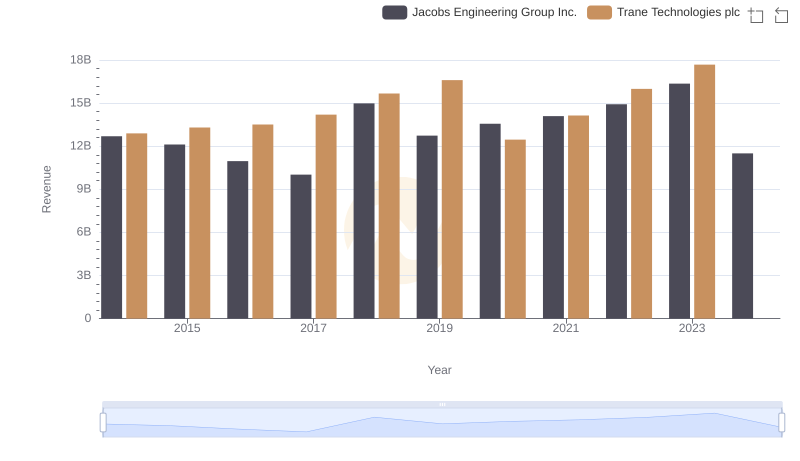
Annual Revenue Comparison: Trane Technologies plc vs Jacobs Engineering Group Inc.
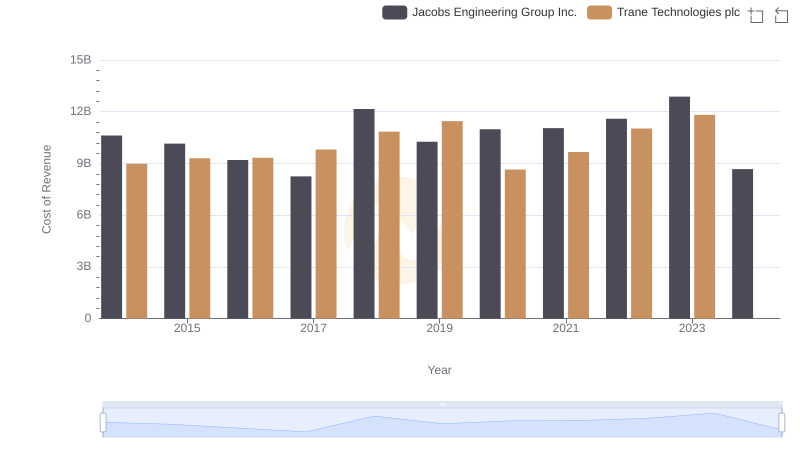
Comparing Cost of Revenue Efficiency: Trane Technologies plc vs Jacobs Engineering Group Inc.
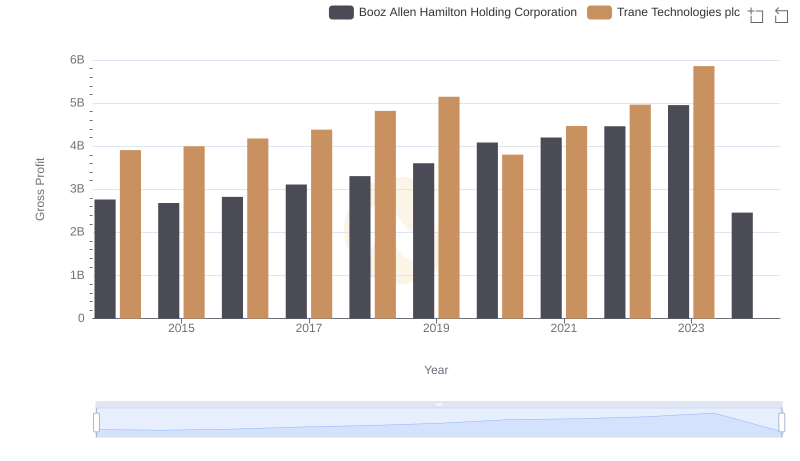
Key Insights on Gross Profit: Trane Technologies plc vs Booz Allen Hamilton Holding Corporation
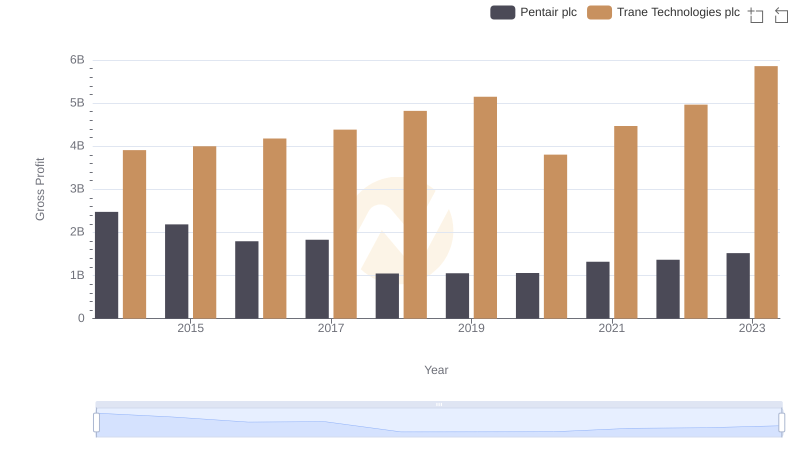
Trane Technologies plc and Pentair plc: A Detailed Gross Profit Analysis
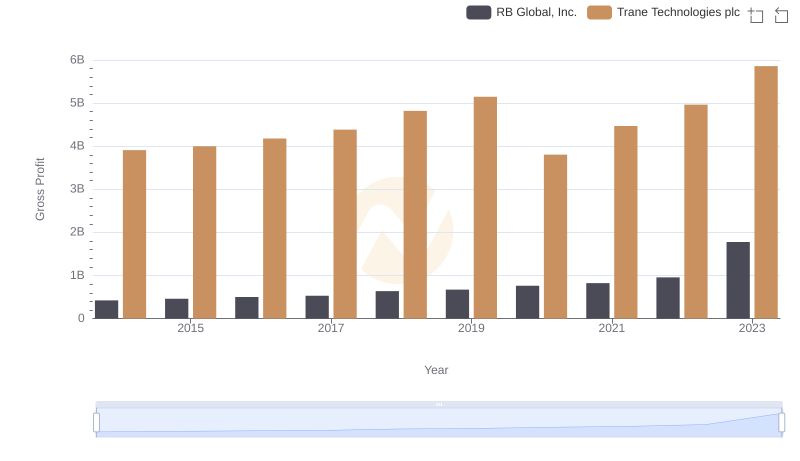
Who Generates Higher Gross Profit? Trane Technologies plc or RB Global, Inc.
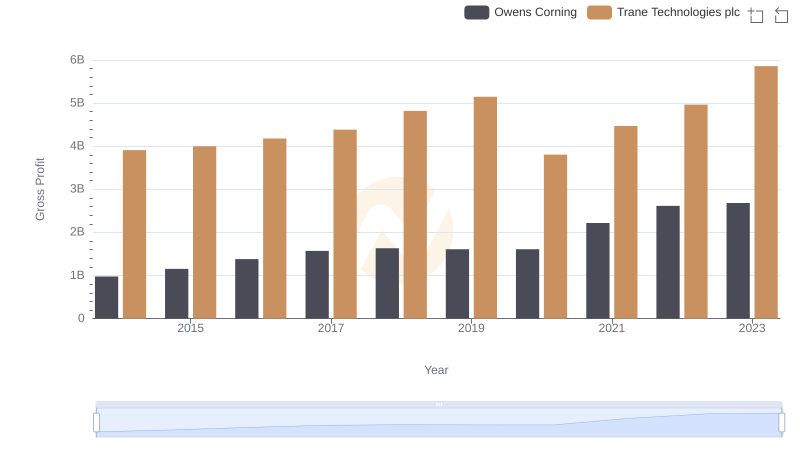
Gross Profit Analysis: Comparing Trane Technologies plc and Owens Corning
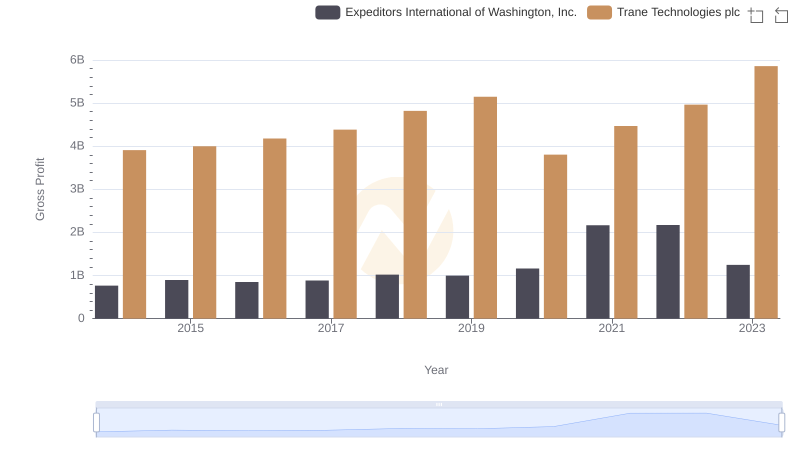
Trane Technologies plc vs Expeditors International of Washington, Inc.: A Gross Profit Performance Breakdown
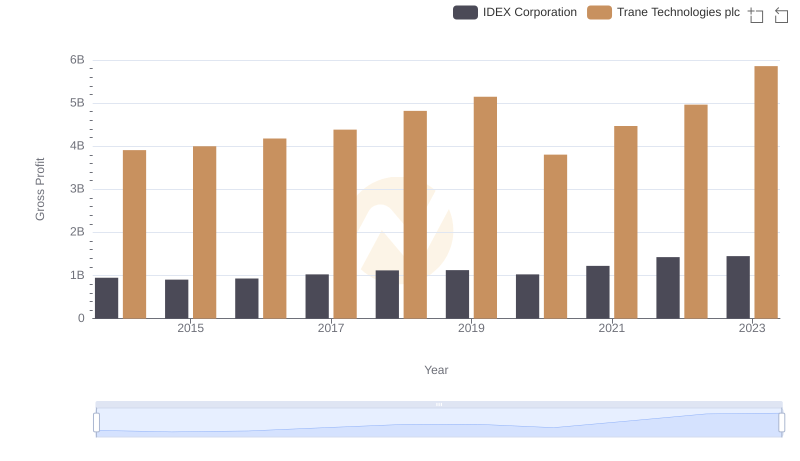
Trane Technologies plc vs IDEX Corporation: A Gross Profit Performance Breakdown
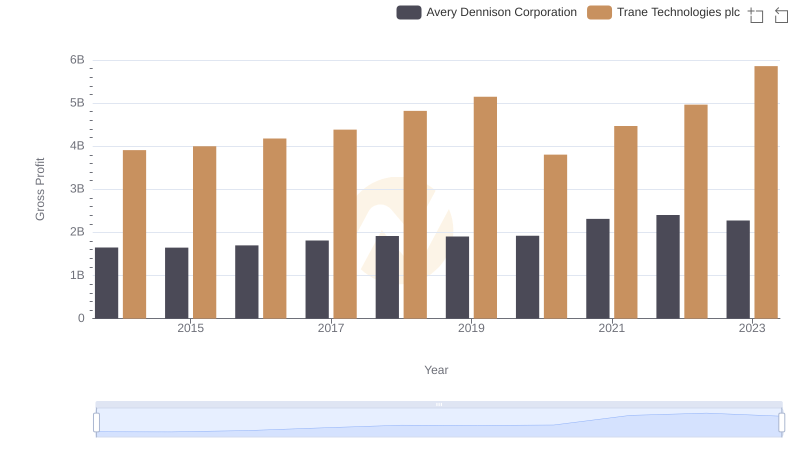
Trane Technologies plc vs Avery Dennison Corporation: A Gross Profit Performance Breakdown
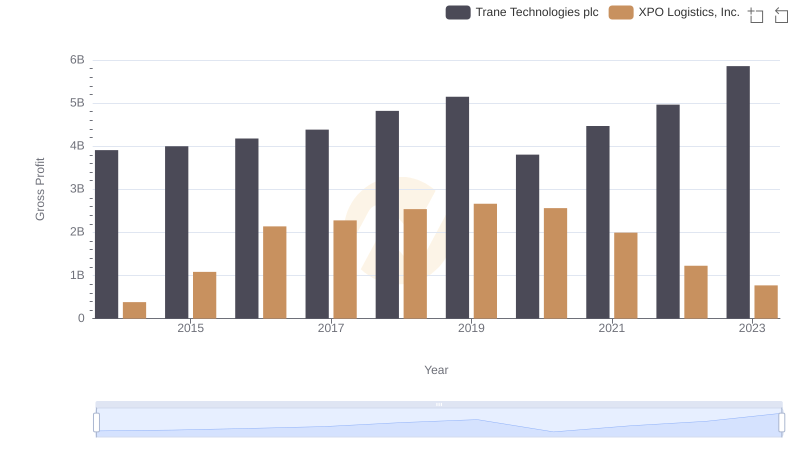
Key Insights on Gross Profit: Trane Technologies plc vs XPO Logistics, Inc.
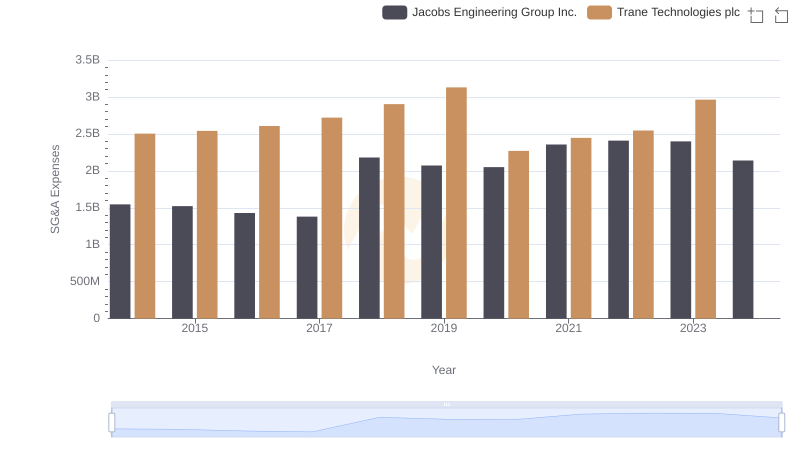
Breaking Down SG&A Expenses: Trane Technologies plc vs Jacobs Engineering Group Inc.
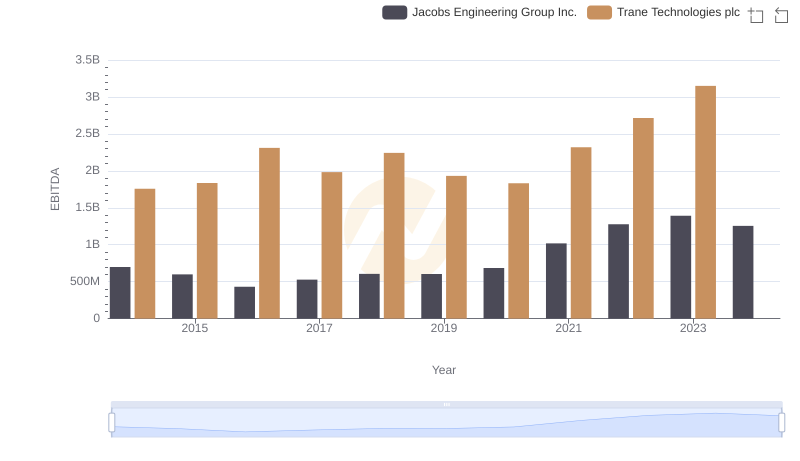
EBITDA Analysis: Evaluating Trane Technologies plc Against Jacobs Engineering Group Inc.