| __timestamp | Trane Technologies plc | XPO Logistics, Inc. |
|---|---|---|
| Wednesday, January 1, 2014 | 3908600000 | 381600000 |
| Thursday, January 1, 2015 | 3999100000 | 1084800000 |
| Friday, January 1, 2016 | 4179600000 | 2139300000 |
| Sunday, January 1, 2017 | 4386000000 | 2279700000 |
| Monday, January 1, 2018 | 4820600000 | 2541000000 |
| Tuesday, January 1, 2019 | 5147400000 | 2666000000 |
| Wednesday, January 1, 2020 | 3803400000 | 2563000000 |
| Friday, January 1, 2021 | 4469600000 | 1994000000 |
| Saturday, January 1, 2022 | 4964800000 | 1227000000 |
| Sunday, January 1, 2023 | 5857200000 | 770000000 |
| Monday, January 1, 2024 | 7080500000 | 915000000 |
Unveiling the hidden dimensions of data
In the ever-evolving landscape of industrial and logistics sectors, understanding financial performance is crucial. Over the past decade, Trane Technologies plc has consistently outperformed XPO Logistics, Inc. in terms of gross profit. From 2014 to 2023, Trane Technologies saw a remarkable growth of approximately 50%, peaking in 2023 with a gross profit of nearly $5.9 billion. In contrast, XPO Logistics experienced a more volatile journey, with its gross profit peaking in 2019 and then declining by about 71% by 2023.
This data highlights the resilience and strategic prowess of Trane Technologies in maintaining a steady upward trajectory, while XPO Logistics faces challenges in sustaining its growth. As the industrial sector continues to adapt to global changes, these insights provide a valuable perspective on the financial health and strategic direction of these two industry giants.
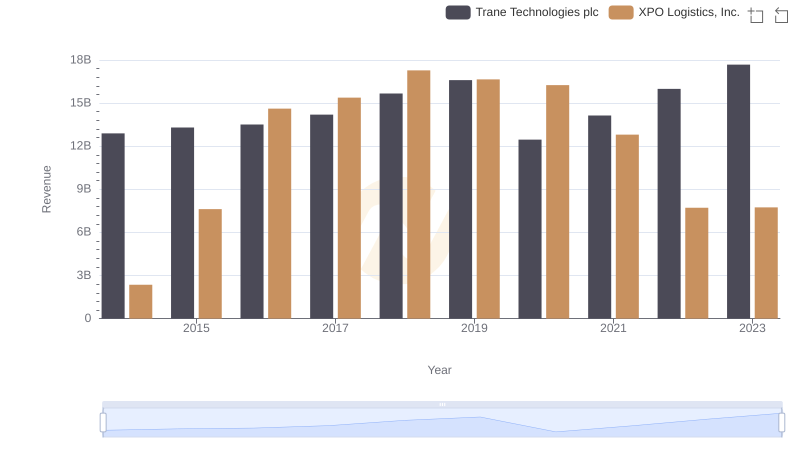
Trane Technologies plc or XPO Logistics, Inc.: Who Leads in Yearly Revenue?
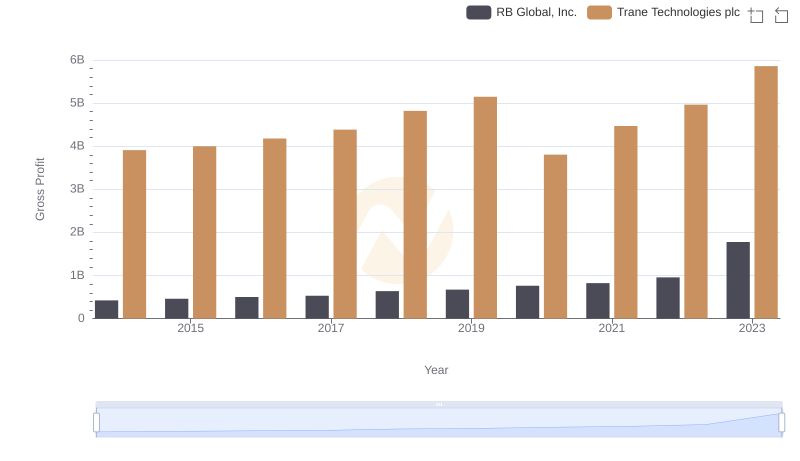
Who Generates Higher Gross Profit? Trane Technologies plc or RB Global, Inc.
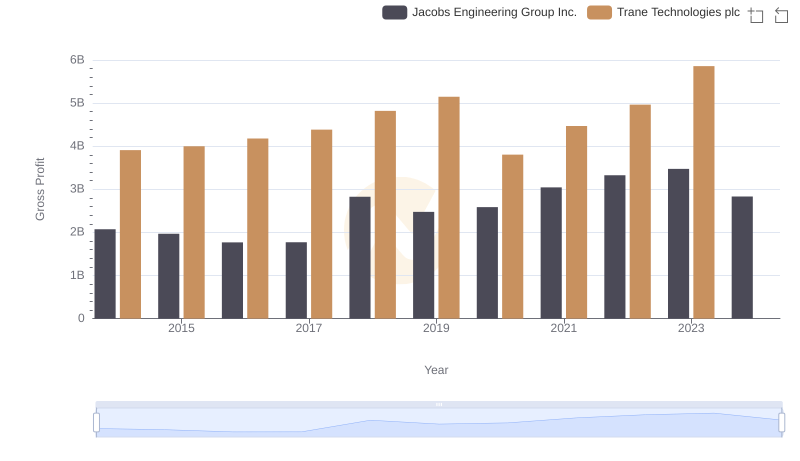
Who Generates Higher Gross Profit? Trane Technologies plc or Jacobs Engineering Group Inc.
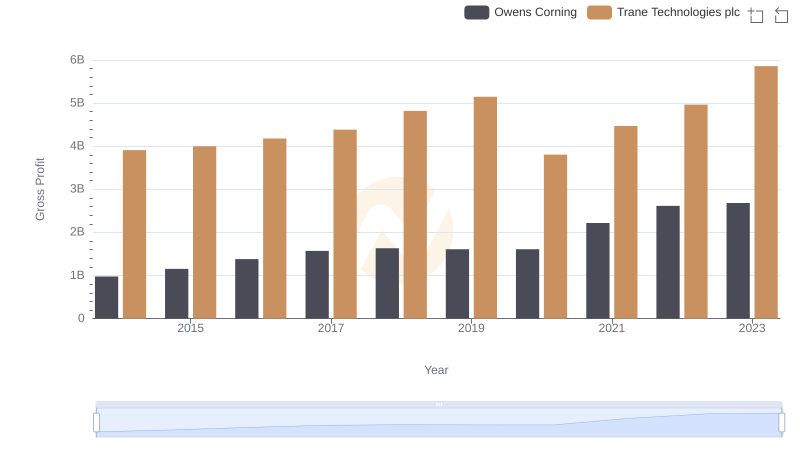
Gross Profit Analysis: Comparing Trane Technologies plc and Owens Corning
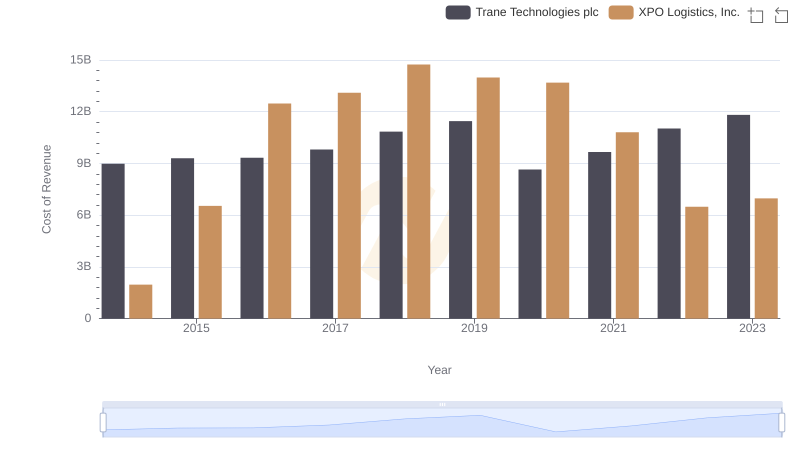
Cost of Revenue Trends: Trane Technologies plc vs XPO Logistics, Inc.
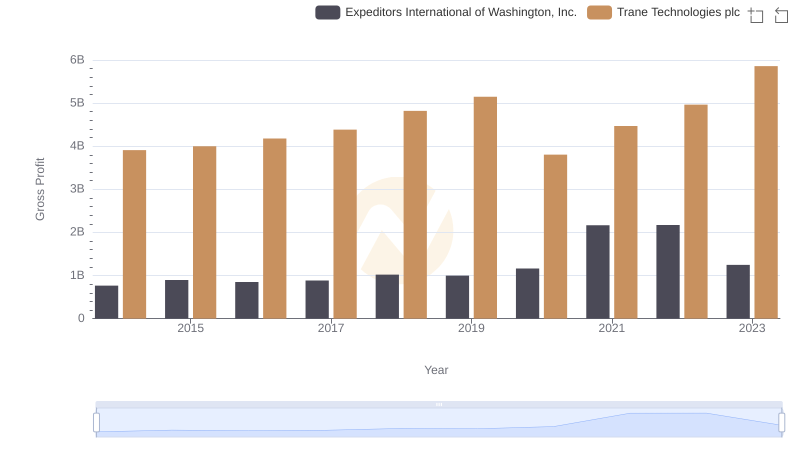
Trane Technologies plc vs Expeditors International of Washington, Inc.: A Gross Profit Performance Breakdown
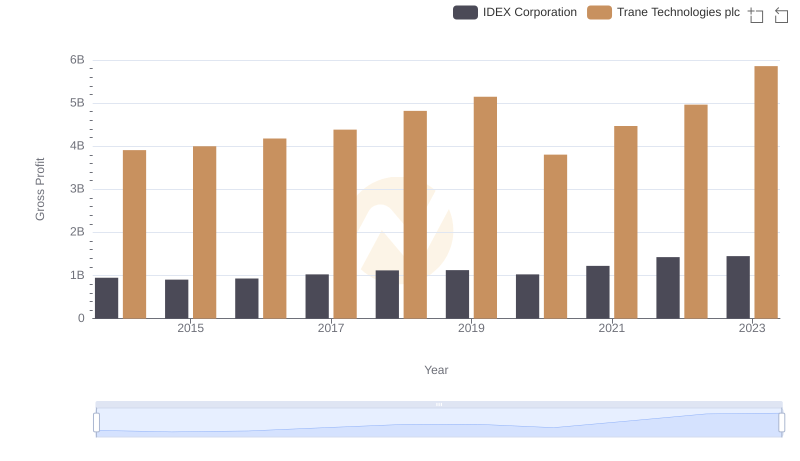
Trane Technologies plc vs IDEX Corporation: A Gross Profit Performance Breakdown
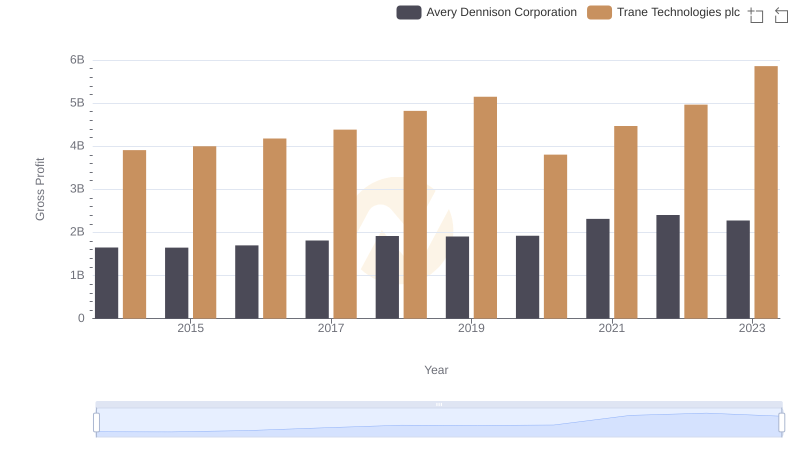
Trane Technologies plc vs Avery Dennison Corporation: A Gross Profit Performance Breakdown
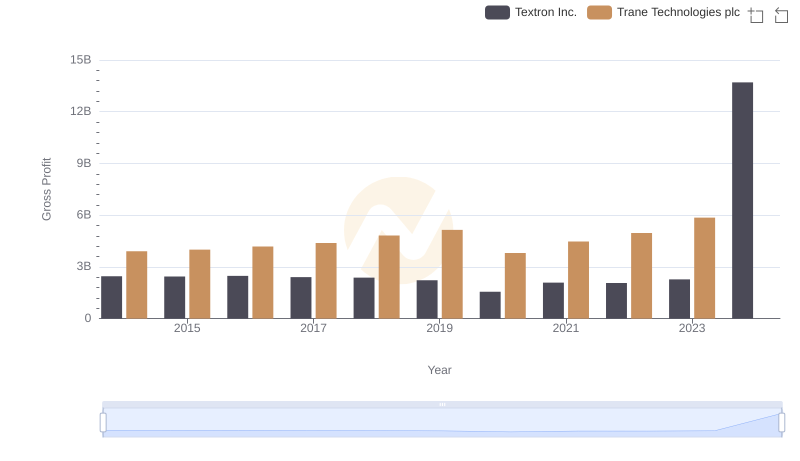
Gross Profit Comparison: Trane Technologies plc and Textron Inc. Trends
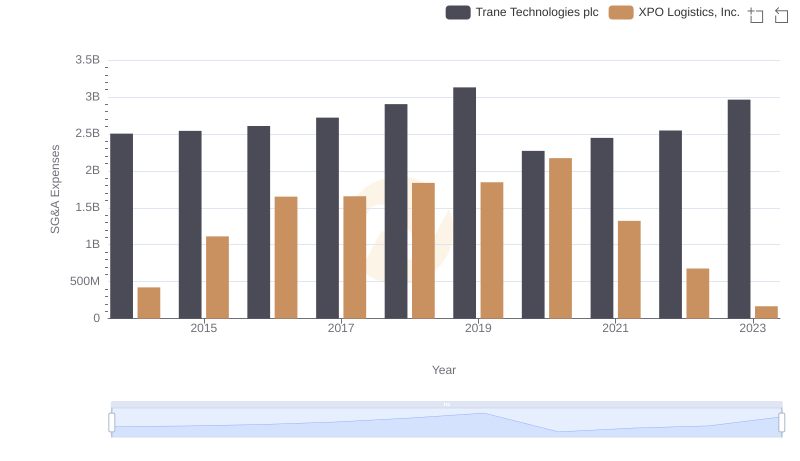
Cost Management Insights: SG&A Expenses for Trane Technologies plc and XPO Logistics, Inc.
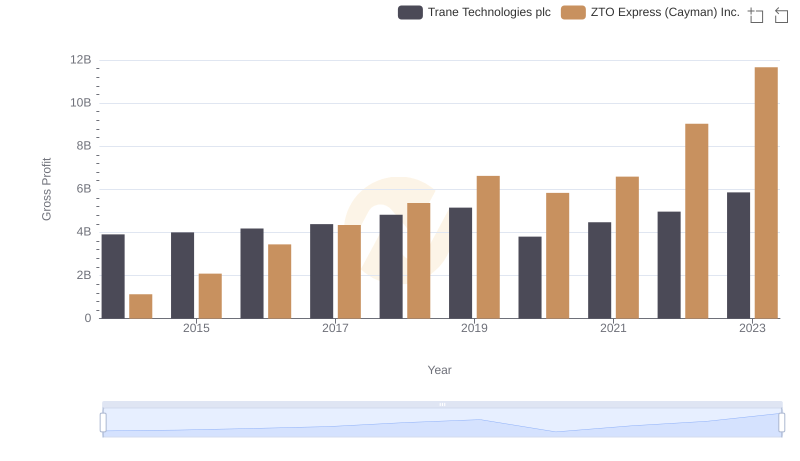
Gross Profit Trends Compared: Trane Technologies plc vs ZTO Express (Cayman) Inc.
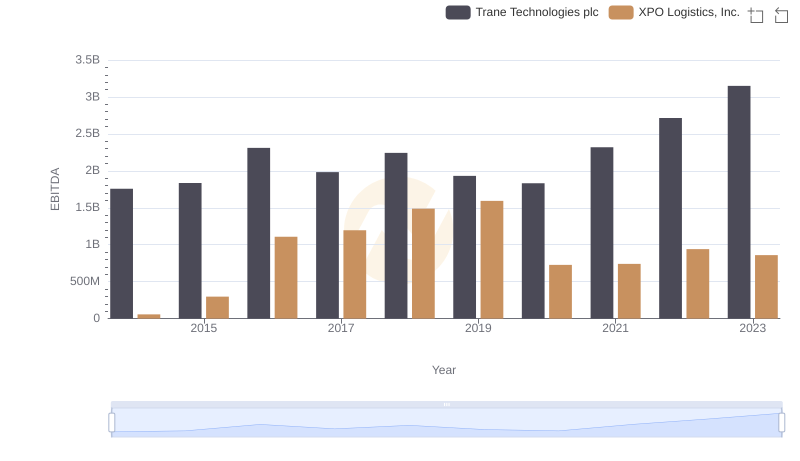
A Professional Review of EBITDA: Trane Technologies plc Compared to XPO Logistics, Inc.