| __timestamp | Owens Corning | Trane Technologies plc |
|---|---|---|
| Wednesday, January 1, 2014 | 5276000000 | 12891400000 |
| Thursday, January 1, 2015 | 5350000000 | 13300700000 |
| Friday, January 1, 2016 | 5677000000 | 13508900000 |
| Sunday, January 1, 2017 | 6384000000 | 14197600000 |
| Monday, January 1, 2018 | 7057000000 | 15668200000 |
| Tuesday, January 1, 2019 | 7160000000 | 16598900000 |
| Wednesday, January 1, 2020 | 7055000000 | 12454700000 |
| Friday, January 1, 2021 | 8498000000 | 14136400000 |
| Saturday, January 1, 2022 | 9761000000 | 15991700000 |
| Sunday, January 1, 2023 | 9677000000 | 17677600000 |
| Monday, January 1, 2024 | 19838200000 |
Igniting the spark of knowledge
In the ever-evolving landscape of industrial innovation, Trane Technologies plc and Owens Corning have emerged as formidable players. Over the past decade, from 2014 to 2023, these companies have demonstrated remarkable revenue growth, reflecting their resilience and adaptability in a competitive market.
Trane Technologies has consistently outpaced Owens Corning, with an average annual revenue of approximately $14.6 billion, compared to Owens Corning's $7.2 billion. Notably, Trane Technologies experienced a significant surge in 2023, reaching nearly $17.7 billion, marking a 42% increase from 2014. Meanwhile, Owens Corning's revenue peaked in 2022 at $9.8 billion, a 85% rise from its 2014 figures.
This data underscores the dynamic nature of the industrial sector, where strategic innovation and market adaptation are key to sustained growth. As these companies continue to evolve, their trajectories offer valuable insights into the future of industrial revenue trends.
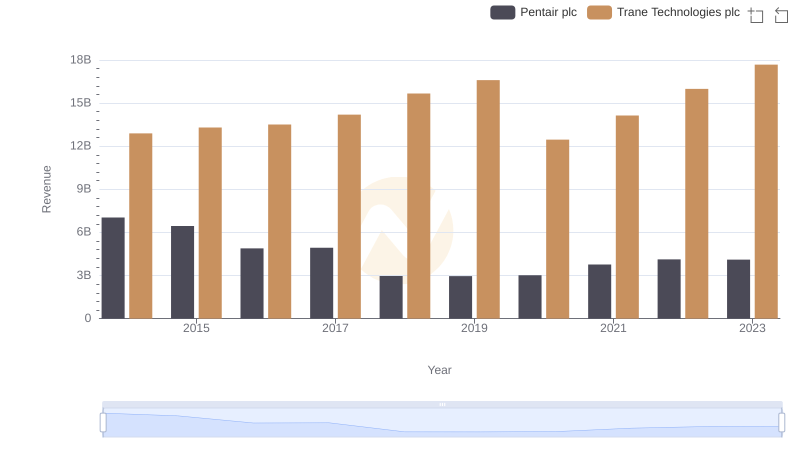
Trane Technologies plc vs Pentair plc: Examining Key Revenue Metrics
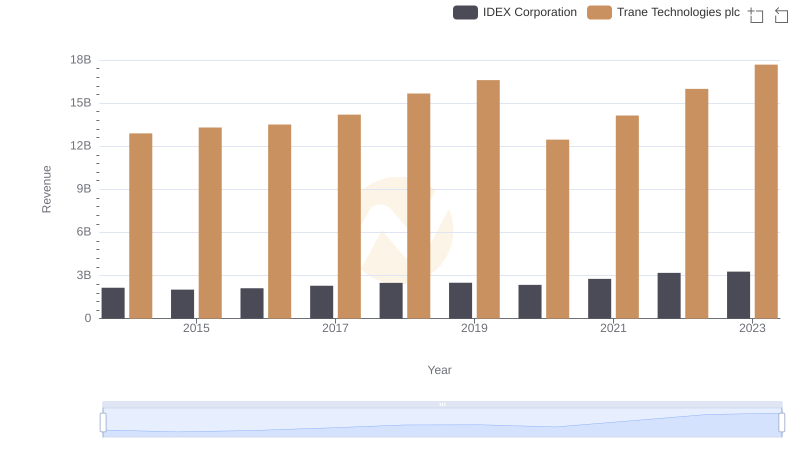
Who Generates More Revenue? Trane Technologies plc or IDEX Corporation
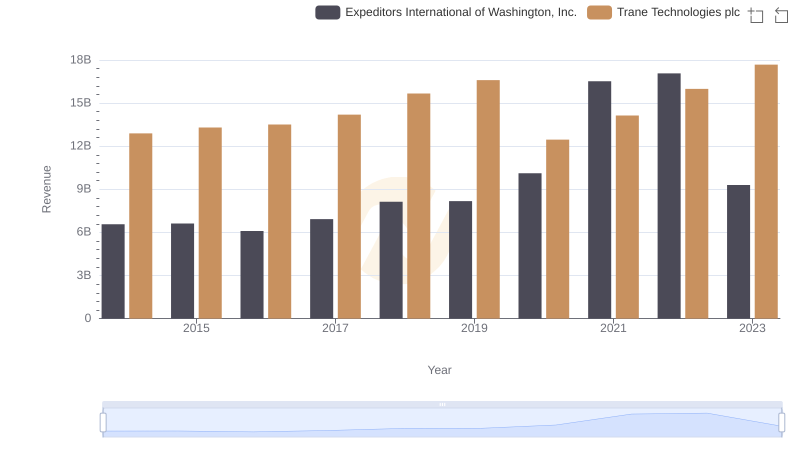
Annual Revenue Comparison: Trane Technologies plc vs Expeditors International of Washington, Inc.
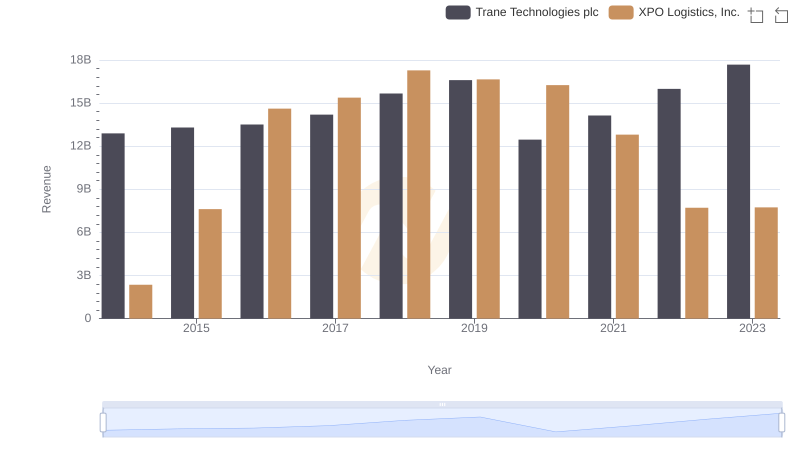
Trane Technologies plc or XPO Logistics, Inc.: Who Leads in Yearly Revenue?
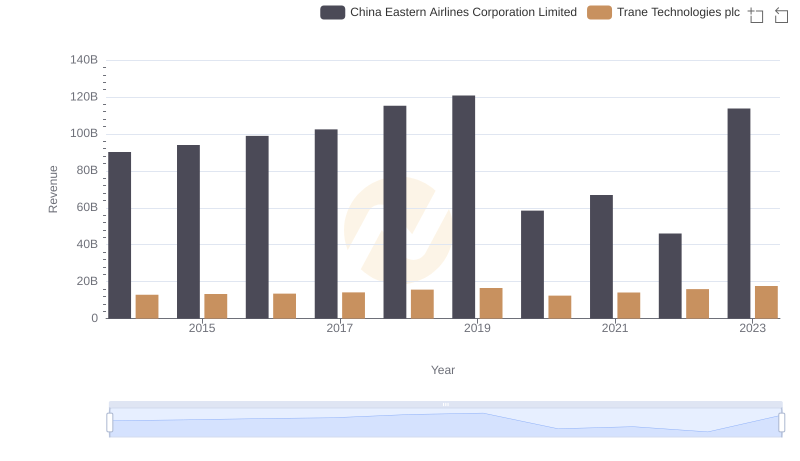
Breaking Down Revenue Trends: Trane Technologies plc vs China Eastern Airlines Corporation Limited
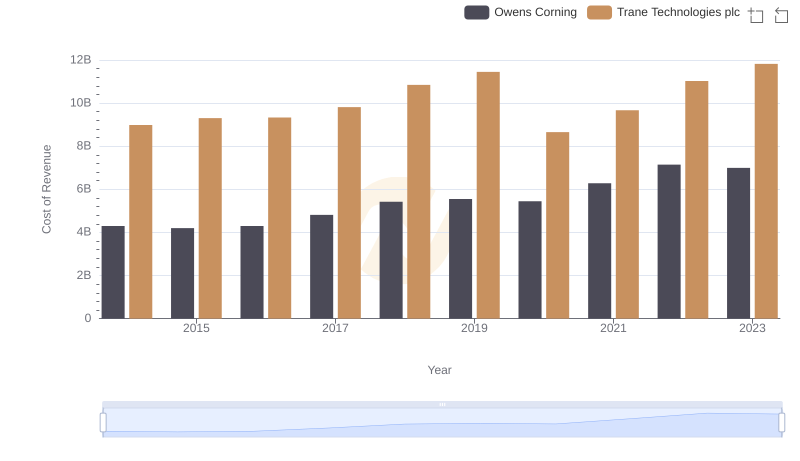
Cost Insights: Breaking Down Trane Technologies plc and Owens Corning's Expenses
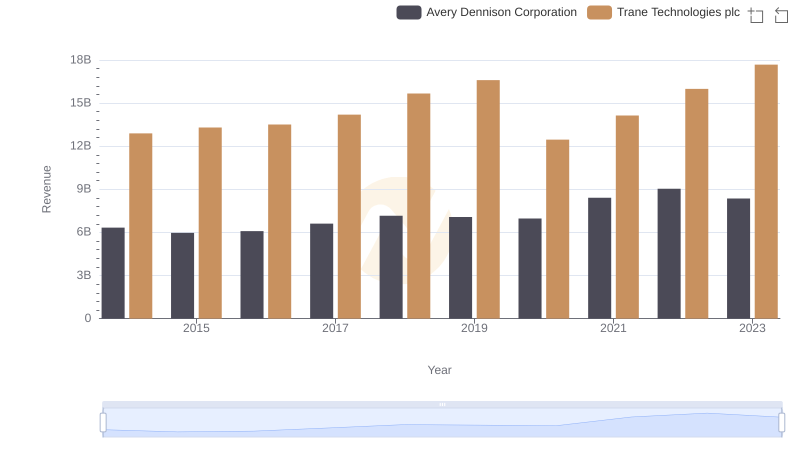
Trane Technologies plc vs Avery Dennison Corporation: Examining Key Revenue Metrics
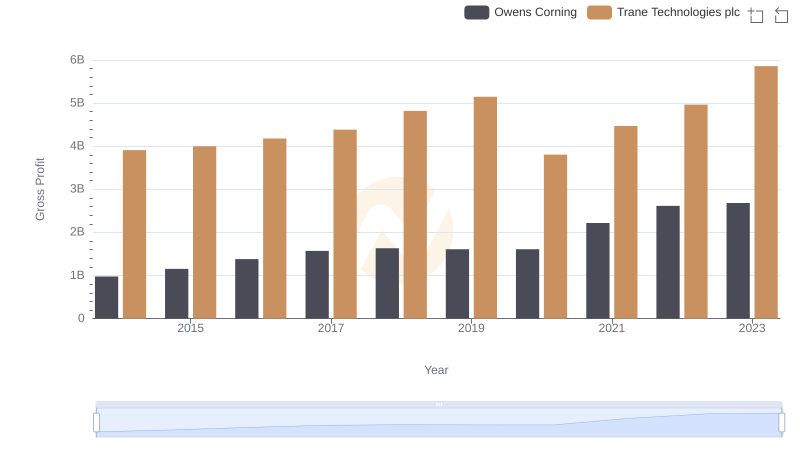
Gross Profit Analysis: Comparing Trane Technologies plc and Owens Corning
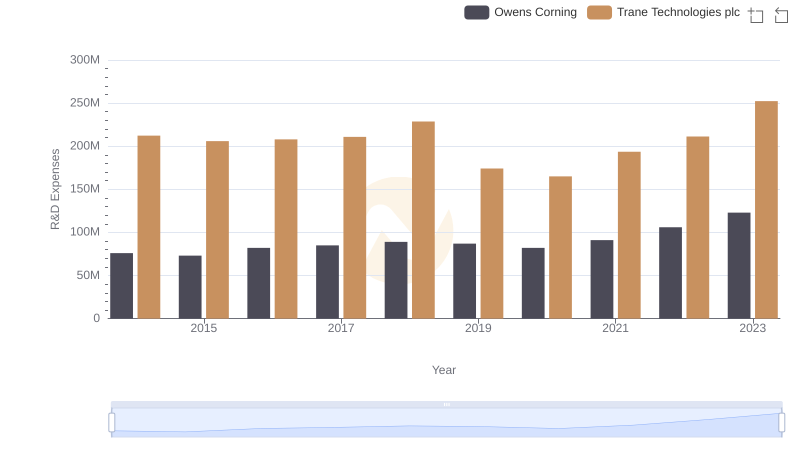
Trane Technologies plc vs Owens Corning: Strategic Focus on R&D Spending
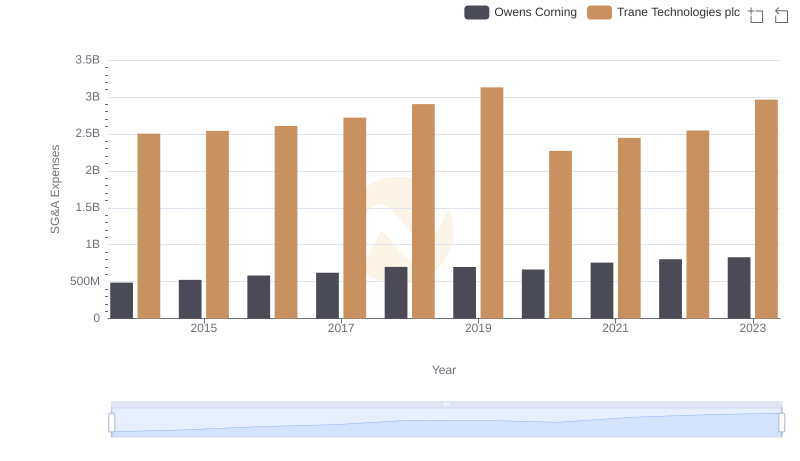
Trane Technologies plc or Owens Corning: Who Manages SG&A Costs Better?
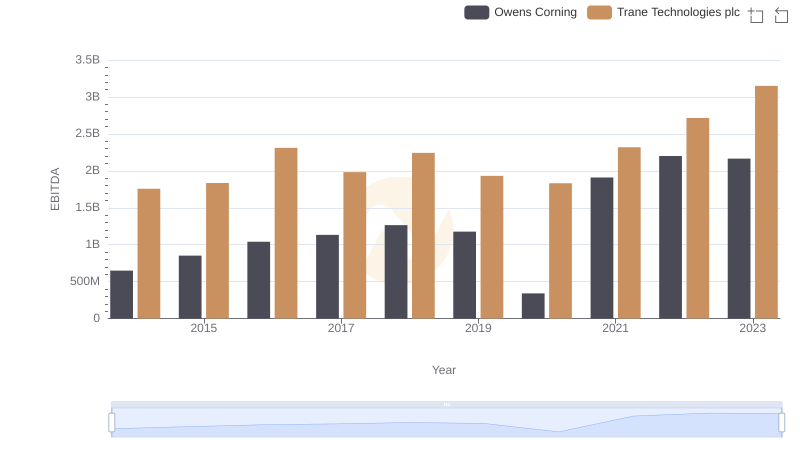
A Professional Review of EBITDA: Trane Technologies plc Compared to Owens Corning