| __timestamp | Owens Corning | Trane Technologies plc |
|---|---|---|
| Wednesday, January 1, 2014 | 4300000000 | 8982800000 |
| Thursday, January 1, 2015 | 4197000000 | 9301600000 |
| Friday, January 1, 2016 | 4296000000 | 9329300000 |
| Sunday, January 1, 2017 | 4812000000 | 9811600000 |
| Monday, January 1, 2018 | 5425000000 | 10847600000 |
| Tuesday, January 1, 2019 | 5551000000 | 11451500000 |
| Wednesday, January 1, 2020 | 5445000000 | 8651300000 |
| Friday, January 1, 2021 | 6281000000 | 9666800000 |
| Saturday, January 1, 2022 | 7145000000 | 11026900000 |
| Sunday, January 1, 2023 | 6994000000 | 11820400000 |
| Monday, January 1, 2024 | 12757700000 |
Unlocking the unknown
In the ever-evolving landscape of industrial manufacturing, understanding cost structures is pivotal. Trane Technologies plc and Owens Corning, two giants in the sector, have shown distinct trends in their cost of revenue over the past decade. From 2014 to 2023, Trane Technologies consistently outpaced Owens Corning, with costs peaking at approximately 11.8 billion in 2023, marking a 32% increase from 2014. Meanwhile, Owens Corning's expenses rose by 63% over the same period, reaching nearly 7 billion in 2023. This divergence highlights Trane's robust cost management strategies, even amidst fluctuating market conditions. As we delve deeper into these figures, it becomes evident that strategic financial planning and operational efficiency are key drivers of success in this competitive arena. Stay tuned as we continue to unravel the financial narratives of industry leaders.
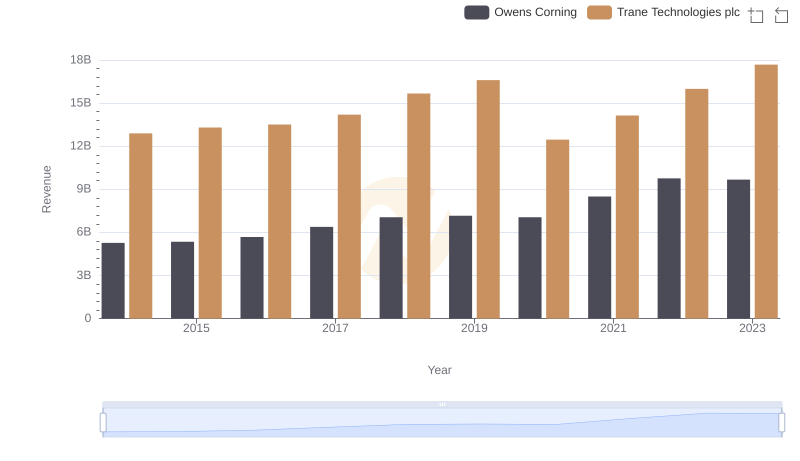
Trane Technologies plc vs Owens Corning: Annual Revenue Growth Compared
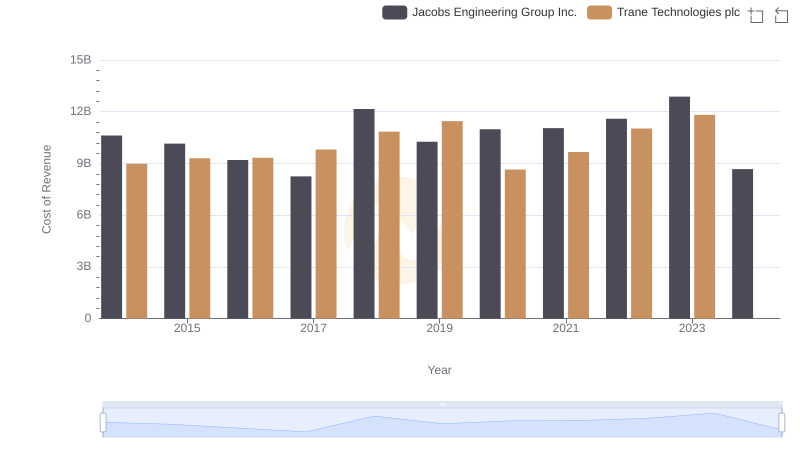
Comparing Cost of Revenue Efficiency: Trane Technologies plc vs Jacobs Engineering Group Inc.
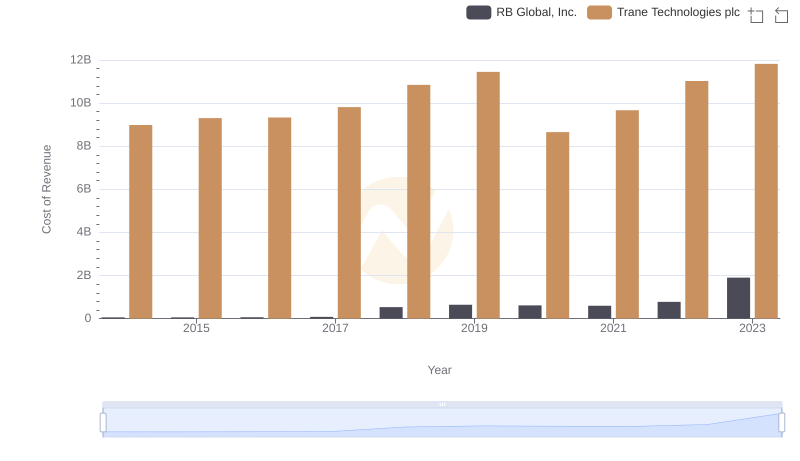
Cost Insights: Breaking Down Trane Technologies plc and RB Global, Inc.'s Expenses

Comparing Cost of Revenue Efficiency: Trane Technologies plc vs IDEX Corporation
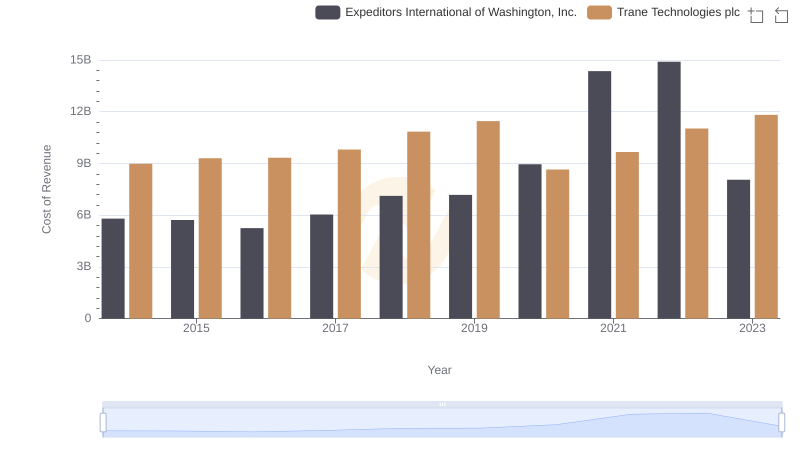
Analyzing Cost of Revenue: Trane Technologies plc and Expeditors International of Washington, Inc.
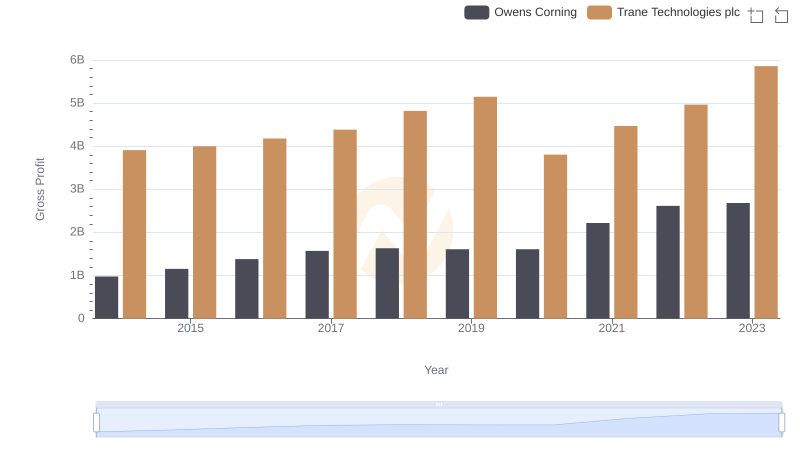
Gross Profit Analysis: Comparing Trane Technologies plc and Owens Corning
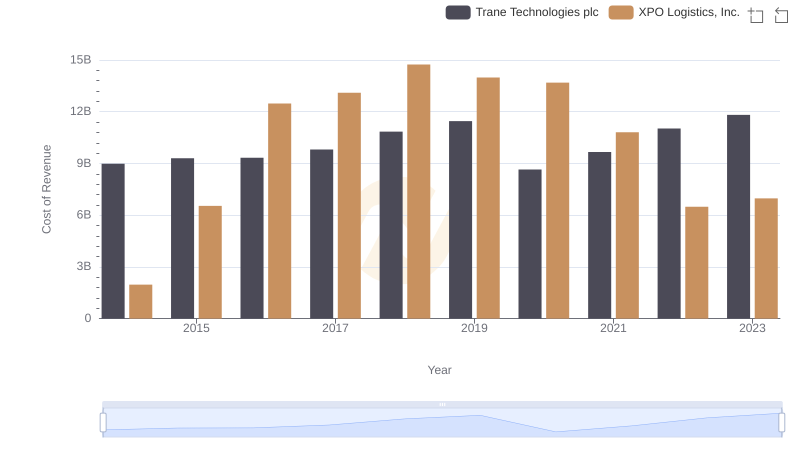
Cost of Revenue Trends: Trane Technologies plc vs XPO Logistics, Inc.
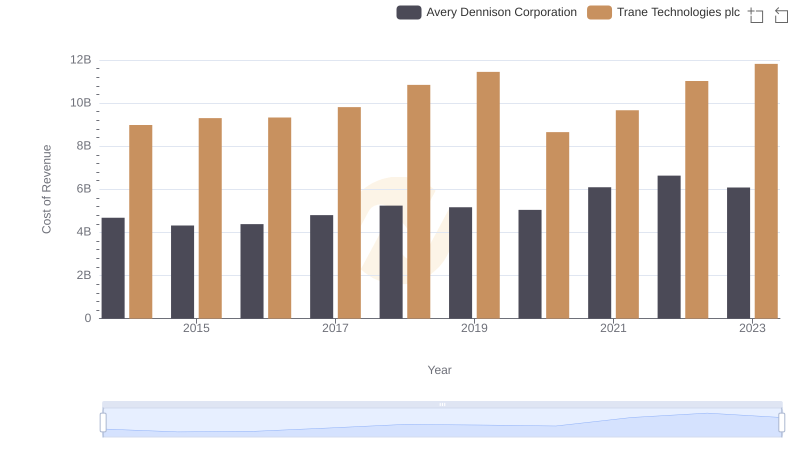
Comparing Cost of Revenue Efficiency: Trane Technologies plc vs Avery Dennison Corporation
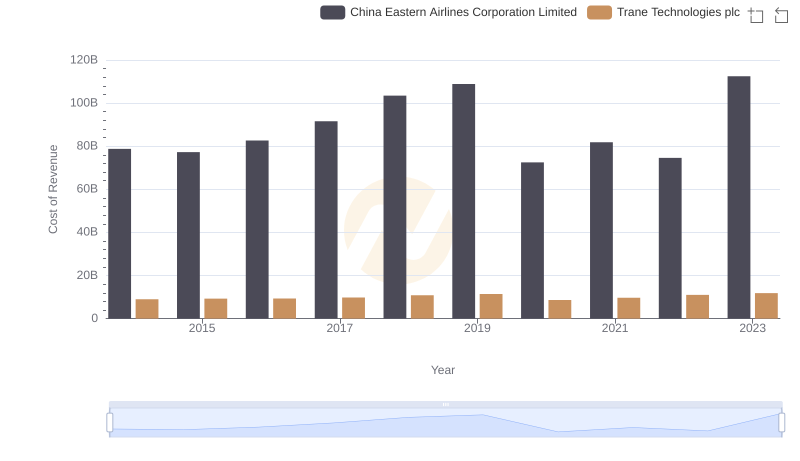
Cost Insights: Breaking Down Trane Technologies plc and China Eastern Airlines Corporation Limited's Expenses
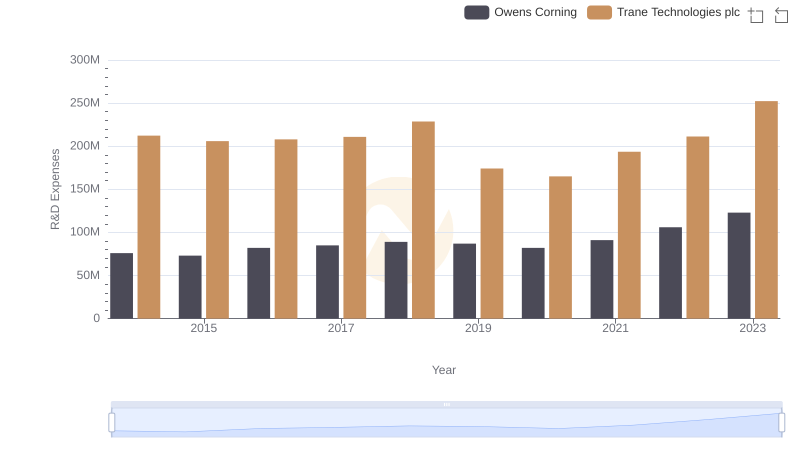
Trane Technologies plc vs Owens Corning: Strategic Focus on R&D Spending
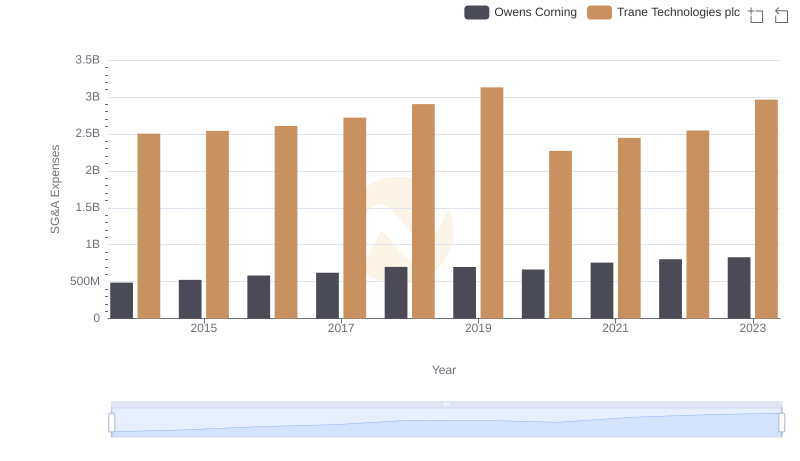
Trane Technologies plc or Owens Corning: Who Manages SG&A Costs Better?
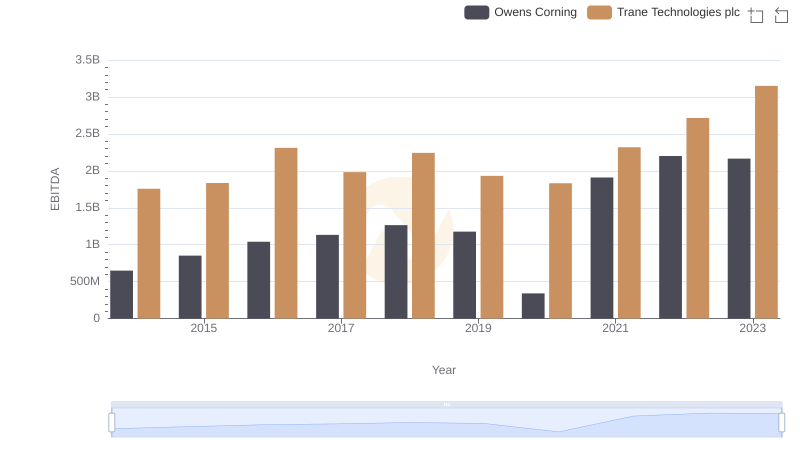
A Professional Review of EBITDA: Trane Technologies plc Compared to Owens Corning