| __timestamp | Avery Dennison Corporation | Trane Technologies plc |
|---|---|---|
| Wednesday, January 1, 2014 | 1651200000 | 3908600000 |
| Thursday, January 1, 2015 | 1645800000 | 3999100000 |
| Friday, January 1, 2016 | 1699700000 | 4179600000 |
| Sunday, January 1, 2017 | 1812200000 | 4386000000 |
| Monday, January 1, 2018 | 1915500000 | 4820600000 |
| Tuesday, January 1, 2019 | 1904100000 | 5147400000 |
| Wednesday, January 1, 2020 | 1923300000 | 3803400000 |
| Friday, January 1, 2021 | 2312800000 | 4469600000 |
| Saturday, January 1, 2022 | 2404200000 | 4964800000 |
| Sunday, January 1, 2023 | 2277499999 | 5857200000 |
| Monday, January 1, 2024 | 2530700000 | 7080500000 |
Unleashing the power of data
In the ever-evolving landscape of industrial innovation, Trane Technologies and Avery Dennison stand as titans of their respective fields. Over the past decade, these companies have showcased remarkable resilience and growth in their gross profit margins. From 2014 to 2023, Trane Technologies consistently outperformed Avery Dennison, with an average gross profit nearly 2.3 times higher. Notably, Trane Technologies saw a significant surge in 2023, achieving a gross profit of approximately 5.86 billion, marking a 20% increase from the previous year.
Avery Dennison, while trailing, demonstrated steady growth, peaking in 2022 with a gross profit of around 2.4 billion. This represents a 45% increase from 2014. The data highlights the dynamic nature of these industries and the strategic maneuvers each company has employed to maintain their competitive edge. As we look to the future, these trends offer valuable insights into the potential trajectories of these industrial leaders.
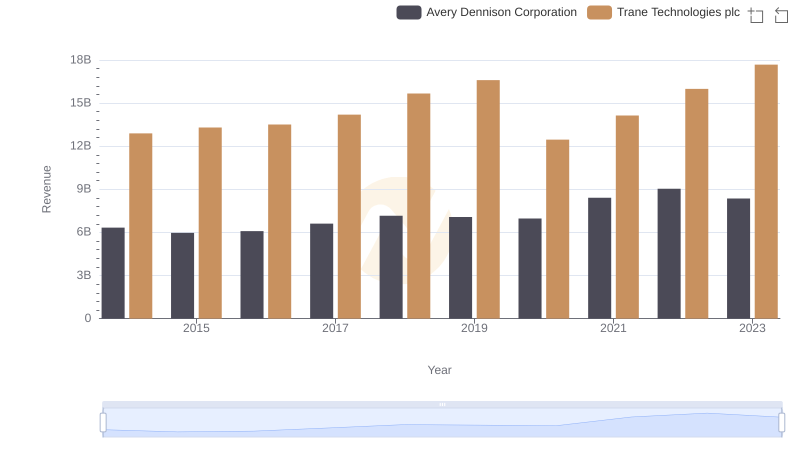
Trane Technologies plc vs Avery Dennison Corporation: Examining Key Revenue Metrics
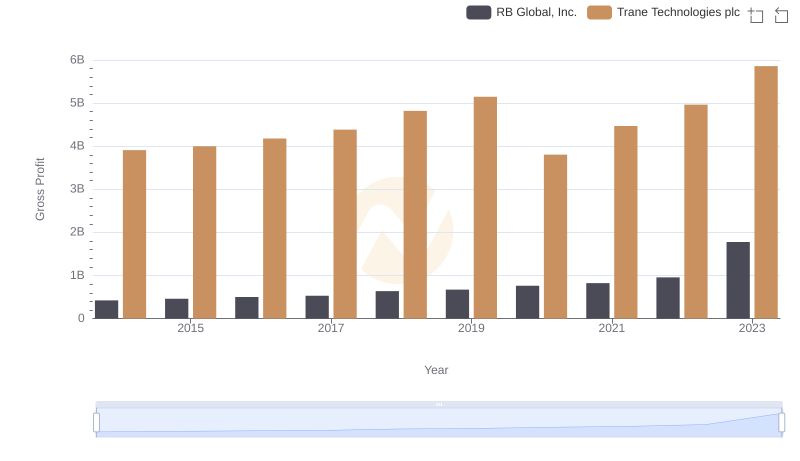
Who Generates Higher Gross Profit? Trane Technologies plc or RB Global, Inc.
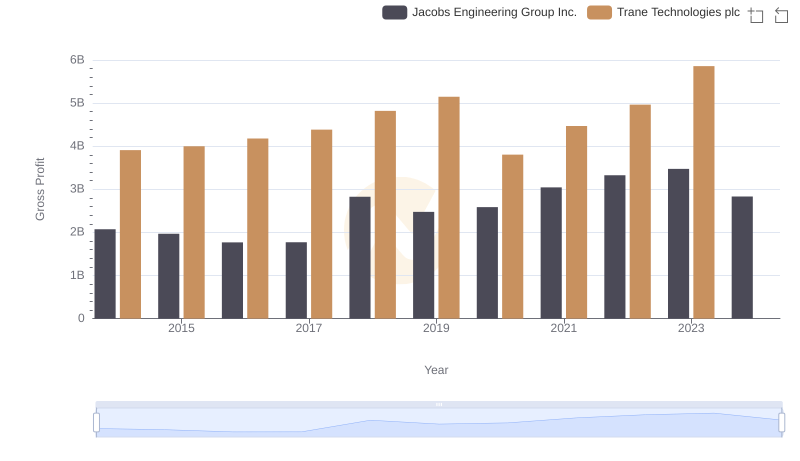
Who Generates Higher Gross Profit? Trane Technologies plc or Jacobs Engineering Group Inc.
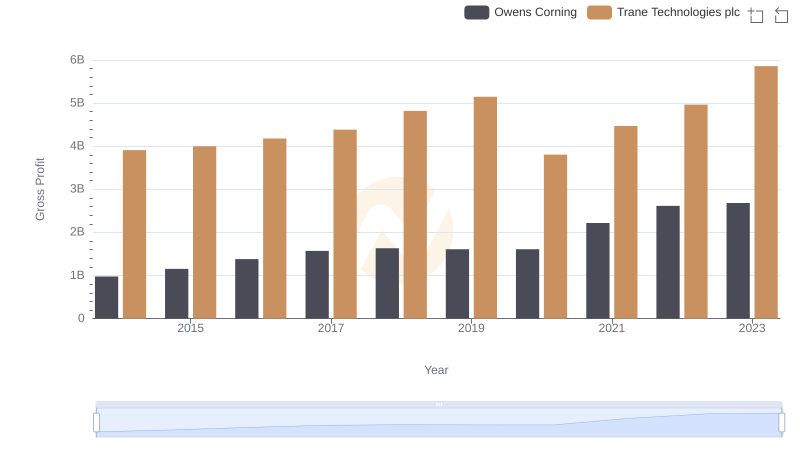
Gross Profit Analysis: Comparing Trane Technologies plc and Owens Corning
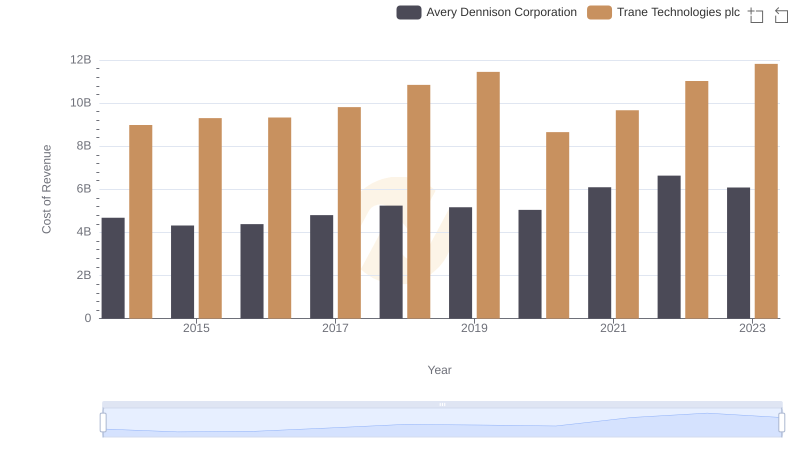
Comparing Cost of Revenue Efficiency: Trane Technologies plc vs Avery Dennison Corporation
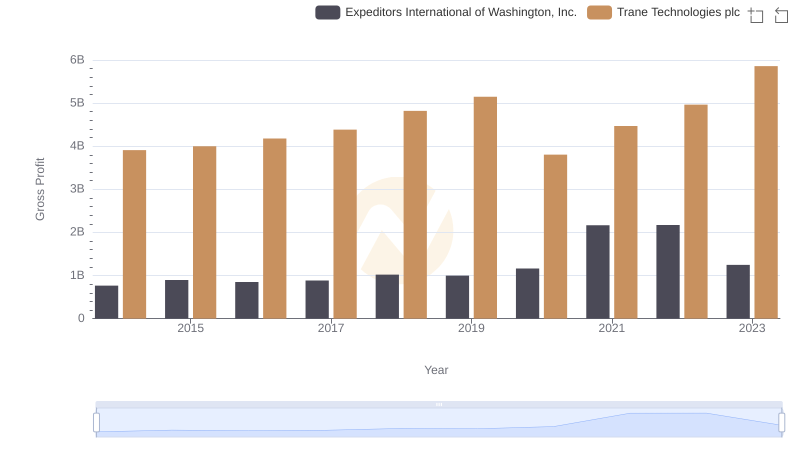
Trane Technologies plc vs Expeditors International of Washington, Inc.: A Gross Profit Performance Breakdown
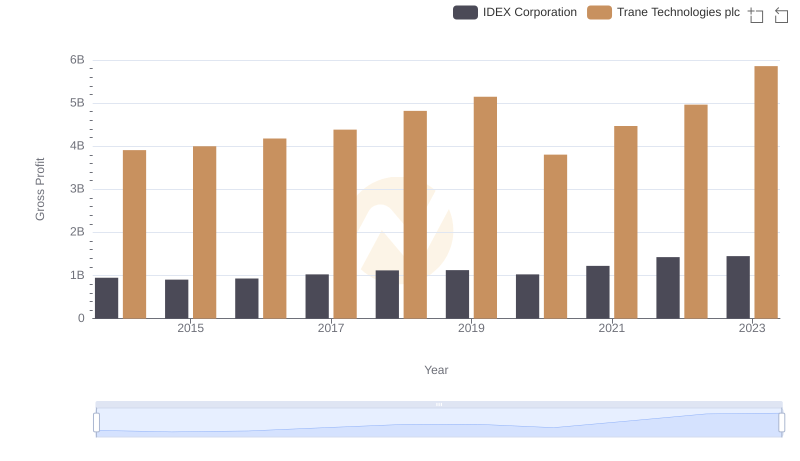
Trane Technologies plc vs IDEX Corporation: A Gross Profit Performance Breakdown
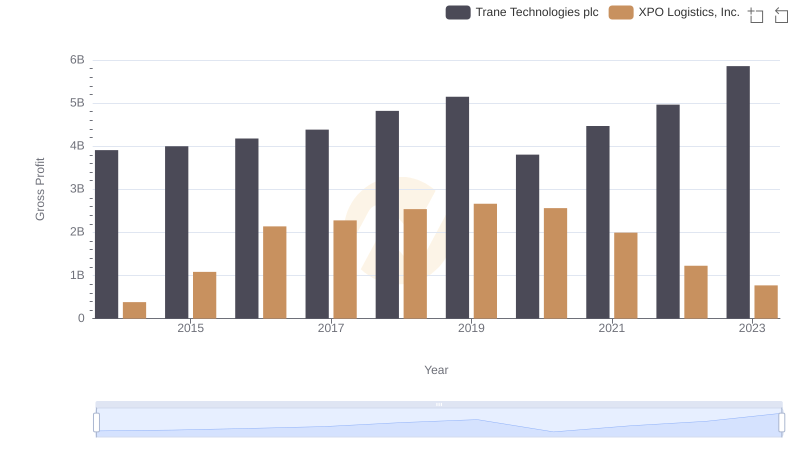
Key Insights on Gross Profit: Trane Technologies plc vs XPO Logistics, Inc.
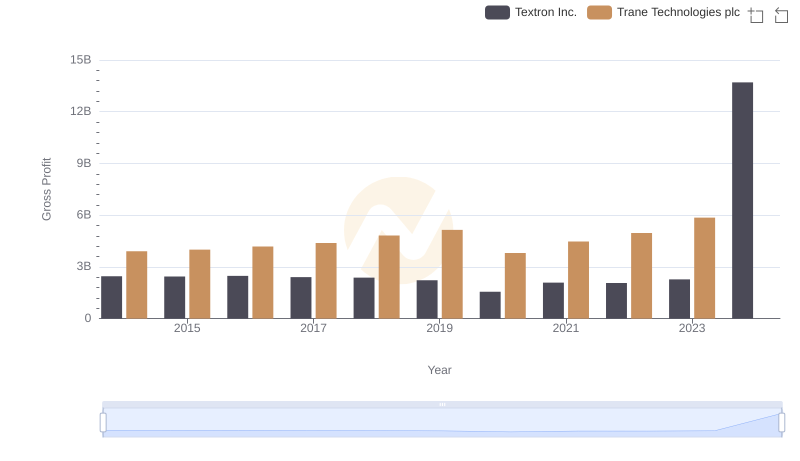
Gross Profit Comparison: Trane Technologies plc and Textron Inc. Trends
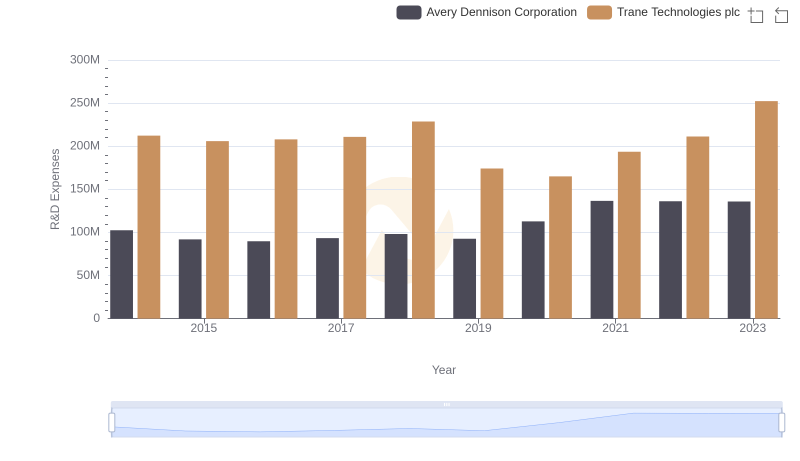
Analyzing R&D Budgets: Trane Technologies plc vs Avery Dennison Corporation
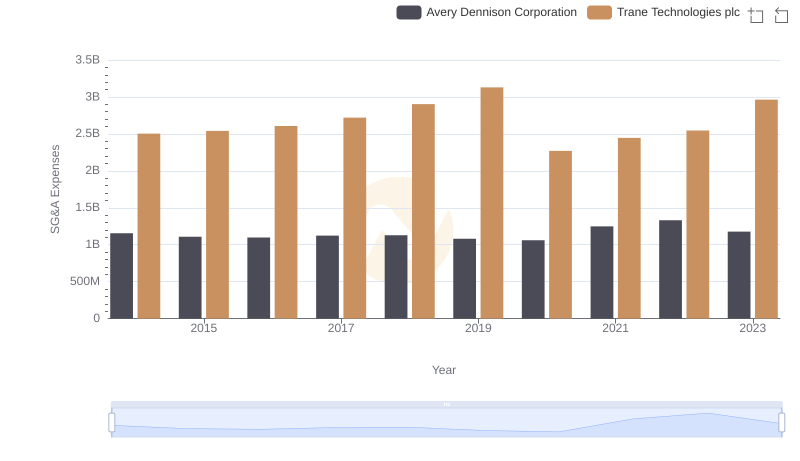
Operational Costs Compared: SG&A Analysis of Trane Technologies plc and Avery Dennison Corporation
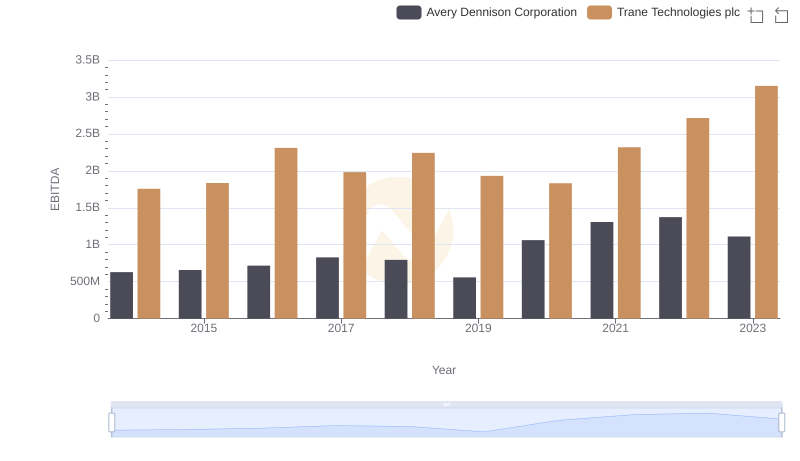
EBITDA Analysis: Evaluating Trane Technologies plc Against Avery Dennison Corporation