| __timestamp | Expeditors International of Washington, Inc. | Trane Technologies plc |
|---|---|---|
| Wednesday, January 1, 2014 | 763996000 | 3908600000 |
| Thursday, January 1, 2015 | 895784000 | 3999100000 |
| Friday, January 1, 2016 | 850793000 | 4179600000 |
| Sunday, January 1, 2017 | 883027000 | 4386000000 |
| Monday, January 1, 2018 | 1020282000 | 4820600000 |
| Tuesday, January 1, 2019 | 997021000 | 5147400000 |
| Wednesday, January 1, 2020 | 1162765000 | 3803400000 |
| Friday, January 1, 2021 | 2165412000 | 4469600000 |
| Saturday, January 1, 2022 | 2171130000 | 4964800000 |
| Sunday, January 1, 2023 | 1245476000 | 5857200000 |
| Monday, January 1, 2024 | 10600515000 | 7080500000 |
Unlocking the unknown
In the competitive landscape of global business, understanding financial performance is crucial. This analysis delves into the gross profit trends of Trane Technologies plc and Expeditors International of Washington, Inc. from 2014 to 2023. Over this period, Trane Technologies consistently outperformed Expeditors International, with an average gross profit nearly four times higher. Notably, Trane Technologies saw a significant increase of approximately 50% from 2014 to 2023, peaking in 2023 with a gross profit of $5.86 billion. Meanwhile, Expeditors International experienced a more volatile journey, with a notable spike in 2021 and 2022, reaching over $2.17 billion, before dropping to $1.25 billion in 2023. This fluctuation highlights the dynamic nature of the logistics industry compared to the more stable growth in the industrial sector. Such insights are invaluable for investors and stakeholders aiming to make informed decisions.
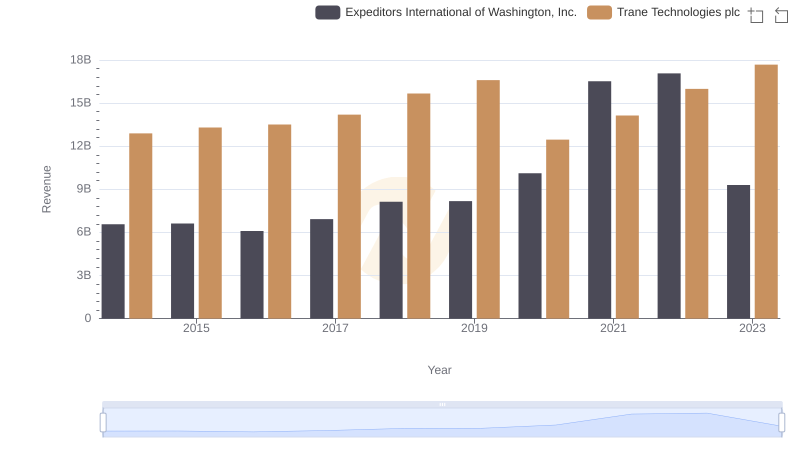
Annual Revenue Comparison: Trane Technologies plc vs Expeditors International of Washington, Inc.
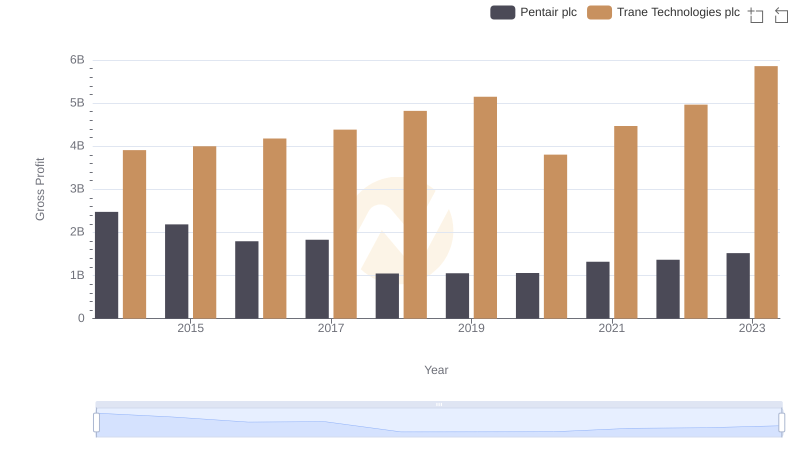
Trane Technologies plc and Pentair plc: A Detailed Gross Profit Analysis
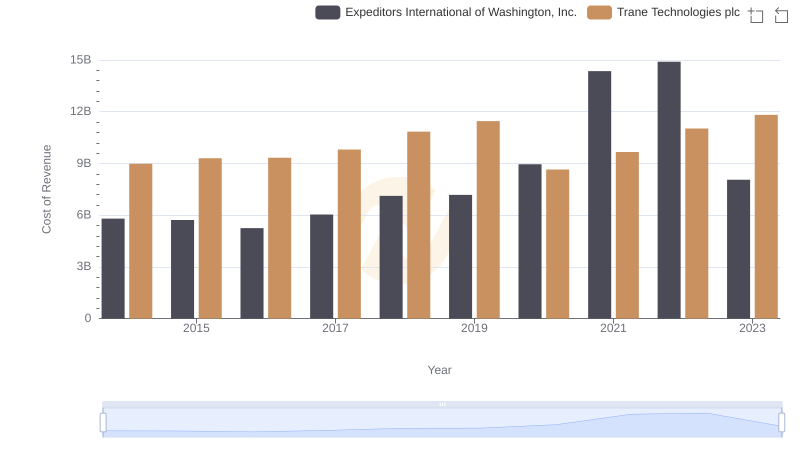
Analyzing Cost of Revenue: Trane Technologies plc and Expeditors International of Washington, Inc.
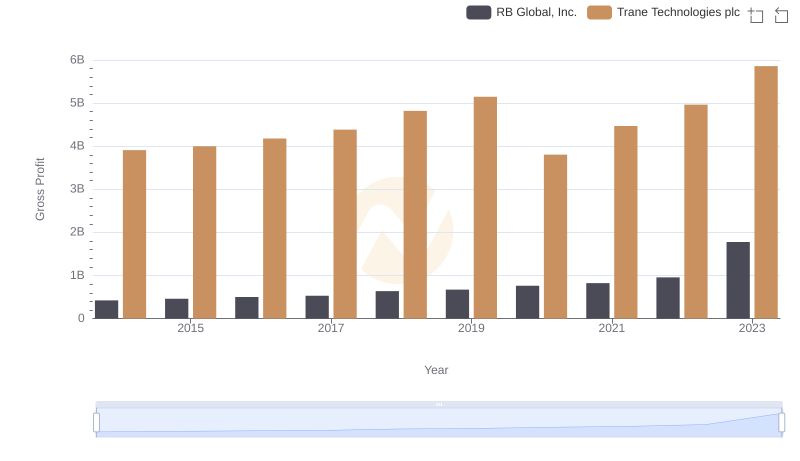
Who Generates Higher Gross Profit? Trane Technologies plc or RB Global, Inc.
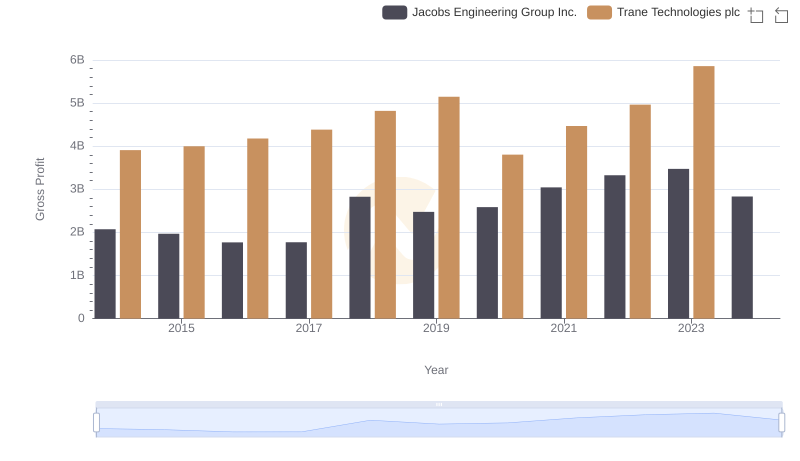
Who Generates Higher Gross Profit? Trane Technologies plc or Jacobs Engineering Group Inc.
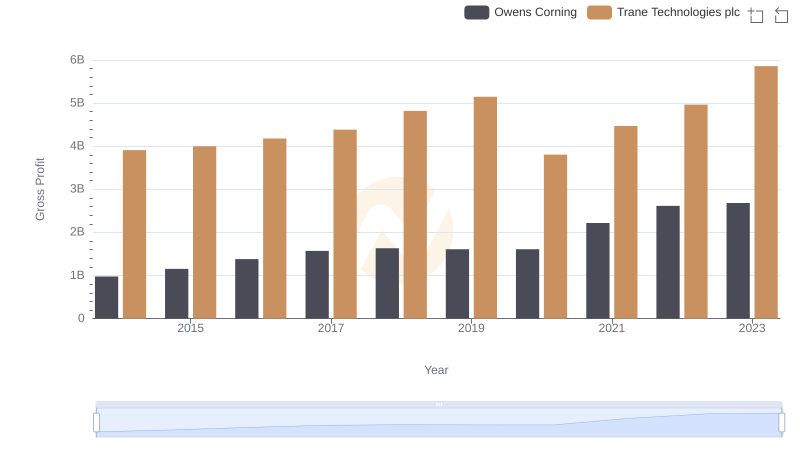
Gross Profit Analysis: Comparing Trane Technologies plc and Owens Corning
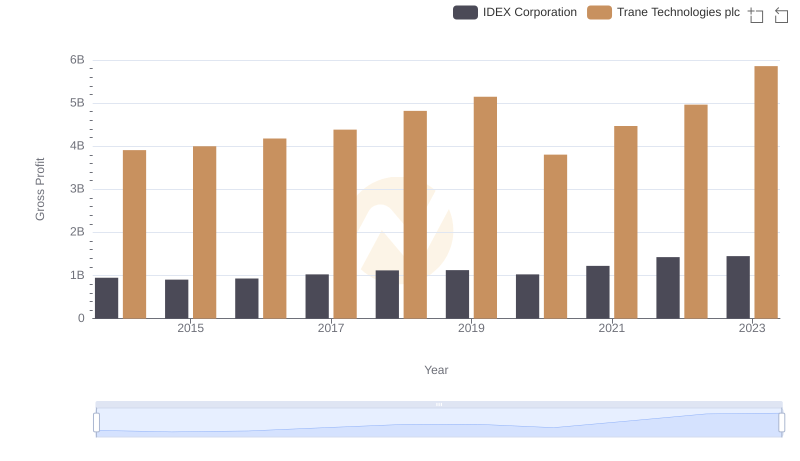
Trane Technologies plc vs IDEX Corporation: A Gross Profit Performance Breakdown
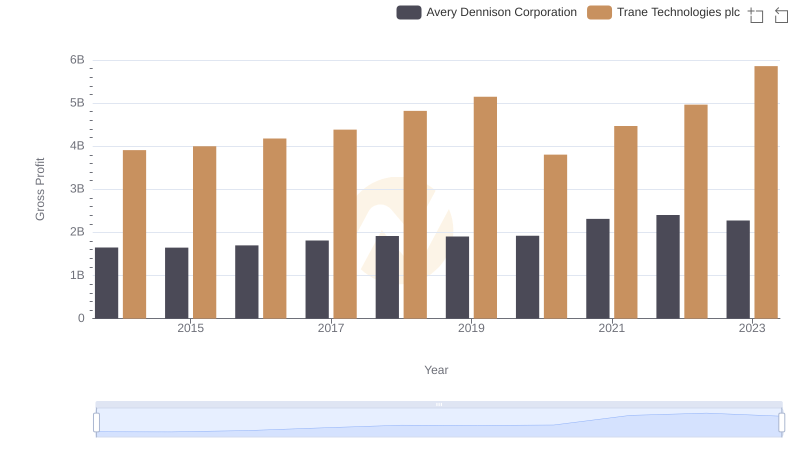
Trane Technologies plc vs Avery Dennison Corporation: A Gross Profit Performance Breakdown
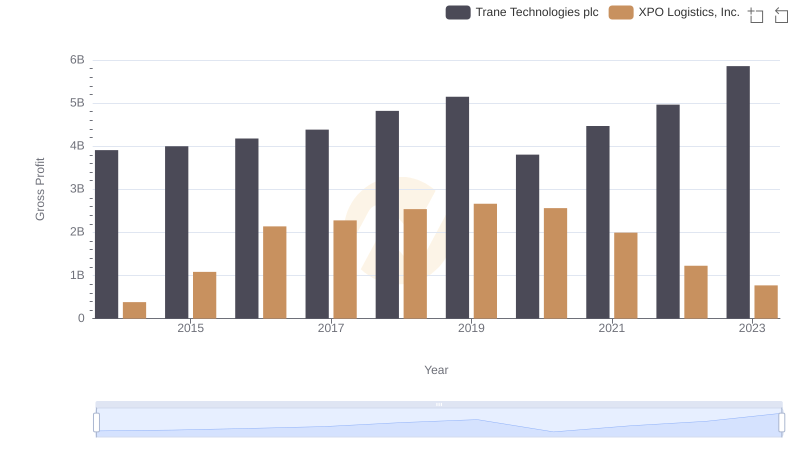
Key Insights on Gross Profit: Trane Technologies plc vs XPO Logistics, Inc.
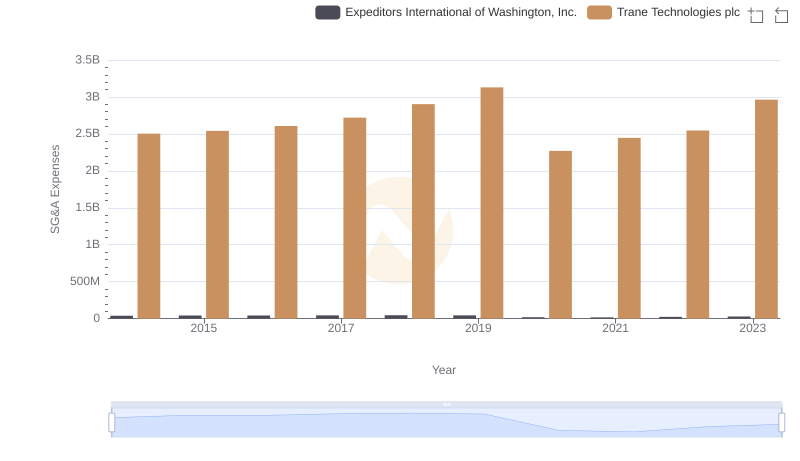
Breaking Down SG&A Expenses: Trane Technologies plc vs Expeditors International of Washington, Inc.
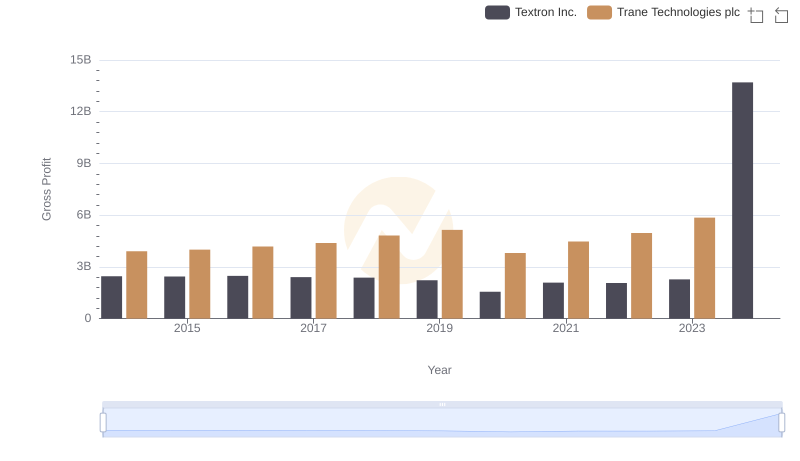
Gross Profit Comparison: Trane Technologies plc and Textron Inc. Trends
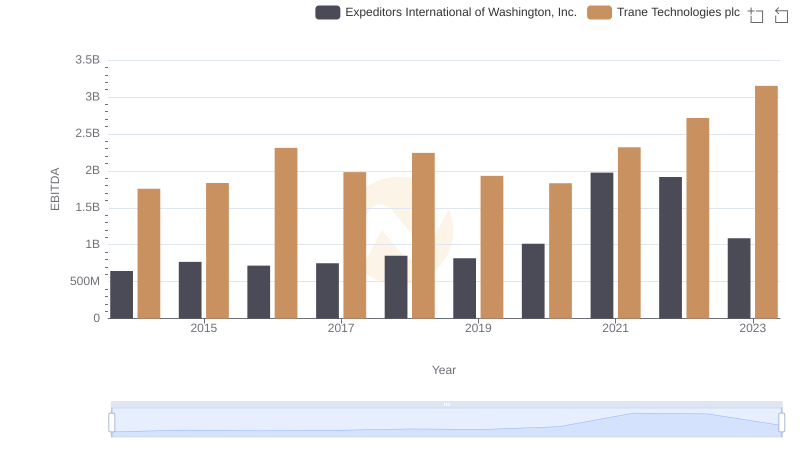
Trane Technologies plc vs Expeditors International of Washington, Inc.: In-Depth EBITDA Performance Comparison